Band 5.0 IELTS Writing Task 1 Model Answer
Overall Band Score: 5.0 · Cambridge IELTS 13 · 2026-11-10
IELTS Writing Task 1 question
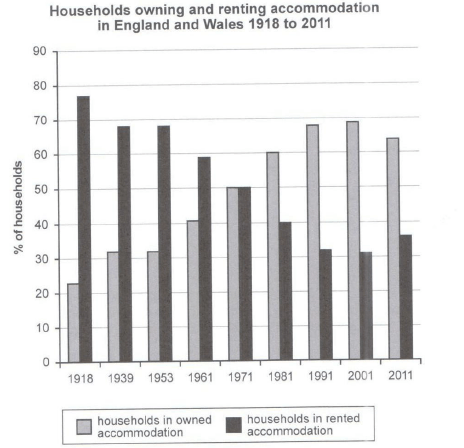
The chart below shows the percentage of households in owned and rented accommodation in England and Wales between 1918 and 2011.
Summarize the information by selecting and reporting the main features and make comparisons where relevant.
Student answer (Band 5.0)
The ar graph illustrates the percentage of households in two different accomodation owned and rented accomodation in England and Wales during 1918 and 2011.
In 1918, percentage of households in rented accomodation stood at 77%, which marked the highest figure. And same in both 1939 and 1953 about 68% and followed in 1961 about 59%, 50% in 1971, 40% in 1981, approximately 33% in 1991, about 36% in 2011. Whereas, approximatley 31% in 2001, which marked the lowest figure.
On the other hand, the percentage of households living in owned accomodation is nearly 69% in 2001, which marked the highest figure and followed by households in 1991 about 68%. 64% in 2011, 60% in 1981 but both accomodations are same in 1971 at 50% therefore, 41% in 1961. And the percentage in 1939 and 1953 was same about 32%. While, in 1918 the percentage stood at 24%, which marked the lowest figure.
AI examiner evaluation
| Criterion | Band |
|---|---|
| Task Achievement / Task Response | 4.5 |
| Coherence and Cohesion | 5.5 |
| Lexical Resource | 5.5 |
| Grammatical Range and Accuracy | 5.0 |
| Overall | 5.0 |
Task Achievement / Task Response: Band 4.5
You report many of the chart’s figures accurately, including the shared 50% point in 1971 and the ownership peak of about 69% in 2001. However, the response mainly lists values rather than summarising the main features, and it lacks a clear overview of the overall shift from renting to owning. The claim that 77% was the highest rented figure is accurate, but calling 31% in 2001 the lowest is misleading: the rented share falls to about 31% in 2001, then rises to 36% in 2011, so this is the low point, not a continuing decline. Add a concise overview and explain the broad trends and crossover to address the task more fully.
Coherence and Cohesion: Band 5.5
The response has a basic, understandable arrangement: it first describes rented accommodation and then owned accommodation, which helps the reader distinguish the two series. Some linking expressions, such as “On the other hand” and “Whereas,” signal contrast. However, progression within the paragraphs is weakened by fragmented or awkwardly attached statements, for example “And same in both 1939 and 1953…” and “While, in 1918…”. The figures are not consistently presented in a smooth chronological sequence, and there is no separate overview to guide the reader through the main pattern. Use a clear introduction, overview, and two logically organised detail paragraphs, with simpler links between comparisons.
Lexical Resource: Band 5.5
You use relevant task vocabulary, including “percentage,” “households,” “rented accommodation,” and “owned accommodation,” and terms such as “stood at” and “marked” help describe figures. However, the range is limited and some phrasing is repetitive, particularly the repeated use of “percentage” and “which marked.” There are also spelling errors in key words, including “accomodation” and “approximatley,” and the opening phrase “two different accomodation” is not a natural collocation. These issues do not prevent the reader from understanding the data, but they reduce precision and control. Practise accurate spelling and vary the language used to describe rises, falls, peaks, and comparisons.
Grammatical Range and Accuracy: Band 5.0
You attempt some longer structures to connect figures, but control is inconsistent, and several sentences are fragments or have faulty construction. For example, “And same in both 1939 and 1953…” lacks a complete clause, while “Whereas, approximately 31% in 2001…” is also incomplete. The opening sentence has an awkward structure, and articles are missing in phrases such as “In 1918, percentage of households…”. Tense use also shifts between past and present, as in “stood” and “is nearly 69%,” although the chart reports historical data. Build complete sentences around each comparison, use the past tense consistently, and check articles and punctuation.
See this exact question answered at other band scores. The same prompt compared across bands.
Browse more IELTS Writing model answers or get your own writing scored by the same AI examiner.