Band 6.0 IELTS Writing Task 1 Model Answer
Overall Band Score: 6.0 · Cambridge IELTS 13 · 2026-11-10
IELTS Writing Task 1 question
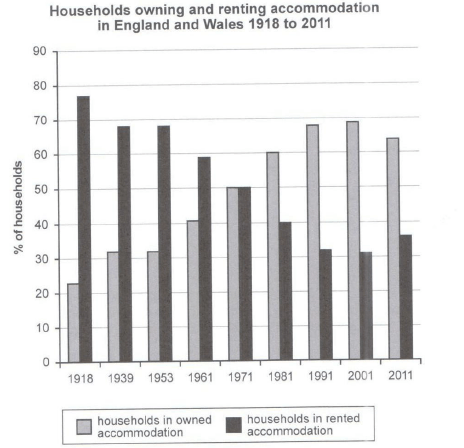
The chart below shows the percentage of households in owned and rented accommodation in England and Wales between 1918 and 2011.
Summarize the information by selecting and reporting the main features and make comparisons where relevant.
Student answer (Band 6.0)
The bar chart illustrates the percentage of households in owned and rented houses in England and Wales from 1918 to 2011.
Overall, the percentage of owner equiped houses increased consistently with a dip in the last decade. On the other hand, the percentage of rented homes decreased gradually and rose in the last ten years.
In 1918, the owned houses were 24% which then increased to 32% in 1939 and remained stable until 1953. The percentage kept on rising until 2001 and reached 68%, which is about 36 % increase in the number of owned houses but in the last decade it dipped 65% which is 3% decline in the proportion.
On the other side, graph tells that the percentage of rented houses was highest in the 1918 and declined to 68% and remained same until 1953. Further it declined steadily until 2001 and reached 31%, which accounts for 37% drop in the housing percentage. In the final decade, the values increased from 31 to 36% which shows 5% growth in rented houses.
AI examiner evaluation
| Criterion | Band |
|---|---|
| Task Achievement / Task Response | 6.5 |
| Coherence and Cohesion | 6.5 |
| Lexical Resource | 5.5 |
| Grammatical Range and Accuracy | 5.5 |
| Overall | 6.0 |
Task Achievement / Task Response: Band 6.5
The response identifies the main overall pattern: ownership generally rose while renting fell, and both reversed direction in the final period. It also selects relevant comparisons, including the equal 50% shares in 1971 and the opposing figures in 2001. Most reported values are close to the chart, though ownership in 2011 is given as 65% rather than about 64%, and the 1918 rented figure is not stated explicitly. The overview’s claim that ownership increased “consistently” is slightly imprecise because it was unchanged between 1939 and 1953. To strengthen the report, state the crossover and endpoint relationship more clearly, and distinguish percentage-point changes from percentage increases or drops.
Coherence and Cohesion: Band 6.5
The response has a clear overall arrangement: an introduction, an overview, and separate paragraphs describing ownership and renting. The sequence within each paragraph is chronological, and linking expressions such as “Overall,” “On the other hand,” and “In the final decade” help the reader follow the trends. However, some connections are mechanical or unclear. For example, “On the other side” is less suitable for introducing the second series, while the long sentence beginning “The percentage kept on rising” joins several comparisons without a clean break. The two data paragraphs also repeat similar structures. More precise transitions and clearer sentence boundaries would make the progression smoother and cohesion less formulaic.
Lexical Resource: Band 5.5
The response uses enough topic vocabulary to describe the chart, including “percentage,” “remained stable,” “declined steadily,” and “proportion.” However, several word choices and collocations are inaccurate or awkward, which limits precision: “owner equiped houses” is not a natural description of households, “the owned houses were 24%” confuses the households with their share, and “growth in rented houses” suggests a rise in the number of homes rather than the percentage. “Housing percentage” is also vague. Spelling in “equipped” is incorrect, though the intended meaning can be inferred. Aim for consistent, accurate terms such as “households in owner-occupied accommodation” and “the proportion of households renting.”
Grammatical Range and Accuracy: Band 5.5
There is a mix of simple and more complex sentence forms, and the main trends remain understandable. The overview uses a clear contrast structure, and clauses with “which” allow you to add figures and comparisons. Some grammatical errors and awkward constructions remain, however. In “the owned houses were 24%,” the subject does not fit the percentage being reported; “the percentage of households owning their homes was 24%” would be clearer. The sentence beginning “The percentage kept on rising” is also overloaded, making the relationship between the 2001 figure and the final-decade decline difficult to follow. Check article use and sentence boundaries, and avoid joining several stages in one sentence. More consistently controlled complex sentences would improve accuracy.
See this exact question answered at other band scores. The same prompt compared across bands.
Browse more IELTS Writing model answers or get your own writing scored by the same AI examiner.