Band 5.5 IELTS Writing Task 1 Model Answer
Overall Band Score: 5.5 · Cambridge IELTS 13 · 2026-11-11
IELTS Writing Task 1 question
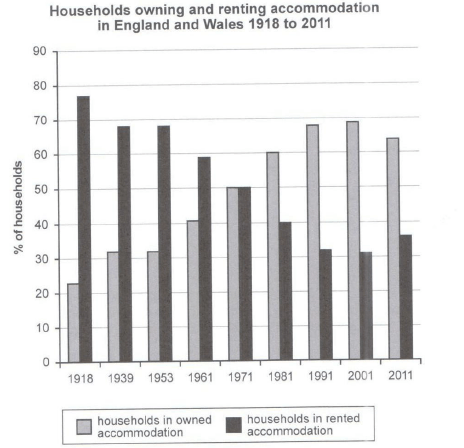
The chart below shows the percentage of households in owned and rented accommodation in England and Wales between 1918 and 2011.
Summarize the information by selecting and reporting the main features and make comparisons where relevant.
Student answer (Band 5.5)
The bar chart compares the proportion of owned and rented households in England and Wales from 1918 to 2011.
Overall, it is clear that owned households' accommodation shows an upward trend, while rented households' accommodation shows a downward trend throughout the period. In 1971, both households' patterns remained stable.
In 1918 almost 78% people preferred rented household accommodation which was by far the highest. In 1939 and 1953, nearly 70% of households in rented, which remained unchanged. After 1953, the proportions of rented households gradually fall 59% in 1961 to 32% in 1991. After that it remained stable in the year 2001. After remain stable to 32% in 2001, there was a slight increase to 35% in 2011.
Regarding the owned households accommodation pattern, the initial year showed only a quater accomodate their household in owned. Throughout the periods this type of accomodation showed significant changes. In this pappern remained steady at 32% in the year of 1939 and 1953 respectively. After that, it followed sharp growth rate. In 2001, it reached at peakest percentage at 69%. In 2011,
AI examiner evaluation
| Criterion | Band |
|---|---|
| Task Achievement / Task Response | 6.0 |
| Coherence and Cohesion | 6.0 |
| Lexical Resource | 5.5 |
| Grammatical Range and Accuracy | 5.0 |
| Overall | 5.5 |
Task Achievement / Task Response: Band 6.0
You identify the chart’s subject and give a relevant overview of the opposing long-term trends. You also report several key figures accurately, including the rented share at about 78% in 1918, the unchanged 32% ownership figures in 1939 and 1953, and ownership peaking at 69% in 2001. However, the overview says the trends continue throughout, overlooking the reversal in 2011: ownership falls to 64% while renting rises to 36%. The statement that both patterns were stable in 1971 is also inaccurate; they meet at 50% that year. The ownership account ends mid-sentence, so its final change is not reported. To strengthen the response, give a complete overview and describe the 2011 reversal clearly.
Coherence and Cohesion: Band 6.0
The response has a recognisable structure: an introduction and overview are followed by separate paragraphs about renting and ownership. Time markers such as “After 1953” and “In 2011” help the reader follow the sequence. However, some connections are repetitive or unclear. For example, the rented paragraph repeats the idea of stability in 2001 (“After that it remained stable” and “After remain stable”), while the ownership paragraph stops abruptly at “In 2011,” leaving the progression incomplete. The overview’s claim about stability in 1971 also makes the organisation of the main details less clear. Aim for one concise account of each trend, avoid repeating the same transition, and finish the final comparison so the response has a complete progression.
Lexical Resource: Band 5.5
You use relevant chart vocabulary, including “proportion,” “upward trend,” “downward trend,” and “remained unchanged,” which helps communicate the main patterns. There are also attempts at more descriptive language, such as “sharp growth rate” and “reached at peakest percentage,” but these combinations are inaccurate or unnatural. Several spelling errors—“quater,” “accomodate,” and “pappern”—also reduce the accuracy of the vocabulary. Phrases such as “people preferred rented household accommodation” are imprecise because the chart reports household shares, not preferences. Build a more reliable range of collocations for describing data, and check spelling and word forms before finishing.
Grammatical Range and Accuracy: Band 5.0
The response includes both simple statements and attempts at longer sentences, for example, “After 1953, the proportions of rented households gradually fall 59% in 1961 to 32% in 1991.” However, some sentence structures and verb forms are inaccurate, including the missing preposition and tense inconsistency in that sentence. Other examples include “nearly 70% of households in rented” and “In 2001, it reached at peakest percentage,” where sentence construction and grammatical patterns are not controlled. The final fragment, “In 2011,” also leaves a sentence unfinished. Use complete clauses, maintain past tense when describing the historical data, and practise accurate comparative structures such as “fell from … to …” and “rose to …”.
See this exact question answered at other band scores. The same prompt compared across bands.
Browse more IELTS Writing model answers or get your own writing scored by the same AI examiner.