Band 5.5 IELTS Writing Task 1 Model Answer
Overall Band Score: 5.5 · Cambridge IELTS 13 · 2026-11-12
IELTS Writing Task 1 question
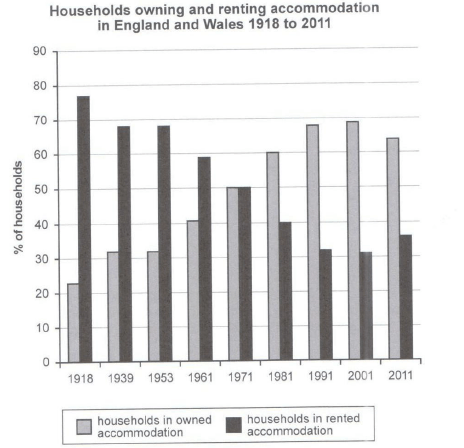
The chart below shows the percentage of households in owned and rented accommodation in England and Wales between 1918 and 2011.
Summarize the information by selecting and reporting the main features and make comparisons where relevant.
Student answer (Band 5.5)
The bar chart illustrates the percentage of household that owned and rented accomodation in england and wales over a period of 93 years, from 1918 to 2011.
overall, it is evident that home ownership increased throughout the period, whereas the portion of household renting expereienced significant decline. both figure were equal in 1971 after that home ownership became the dominant trend.
In 1918, approximatley 22 percent of household owned their home whereas mojority of 78 percent prefer to rent household moving towards till two decades these figure remained almost same in which nearby 30 percent have their own home and the other side almost 70 percent wanted to be an tenant. in 1961 there is slightly decrease in renting household figure with 60 percent and figure of household owning had been upsurged with 40 percent and both figure were equal in 1971.
after 1971 onwards there was trend of owning houses in 1981 60 percent have their home and 40 percent were renting
AI examiner evaluation
| Criterion | Band |
|---|---|
| Task Achievement / Task Response | 5.5 |
| Coherence and Cohesion | 5.5 |
| Lexical Resource | 5.5 |
| Grammatical Range and Accuracy | 5.0 |
| Overall | 5.5 |
Task Achievement / Task Response: Band 5.5
You identify the main contrast: ownership rises overall while renting falls, and you correctly note that the figures meet in 1971. Several early values are also close to the chart, including about 22% owning and 78% renting in 1918. However, the report does not cover the full period: it stops after describing 1981, omitting the later peak in ownership around 2001 and its decline by 2011. The overview also says ownership increased “throughout,” which is not fully accurate because it falls from 69% in 2001 to 64% in 2011. To develop the response further, report the later years and describe the overall trend with this final reversal included.
Coherence and Cohesion: Band 5.5
The response has a recognisable structure, moving from an introduction and overview to chronological details, and phrases such as “In 1918” and “after 1971” help signal time. However, progression becomes difficult to follow in the long middle sentence, which combines the 1918 figures, the following two decades, and 1961 without clear sentence boundaries. The final paragraph is also incomplete in its development, ending after the 1981 comparison rather than bringing the account through to 2011. Use separate sentences or paragraphs for the early period and later changes, and make links between comparisons explicit. This would give the information a clearer overall progression and reduce the strain caused by loosely connected clauses.
Lexical Resource: Band 5.5
You use relevant vocabulary for describing the chart, including “percentage,” “decline,” “dominant,” and “equal,” so the topic is generally clear. However, the range is limited and some choices are inaccurate or unnatural, such as “prefer to rent household,” “wanted to be an tenant,” and “figure ... had been upsurged.” Spelling errors, including “accomodation,” “expereienced,” and “approximatley,” are noticeable and weaken control. Aim for precise, conventional chart language rather than forcing less familiar expressions: for example, say that the proportion of households renting fell, or that ownership rose. More accurate collocations and careful spelling would make the comparisons easier to understand.
Grammatical Range and Accuracy: Band 5.0
You attempt both simple and more complex sentences, but control is inconsistent, particularly when several ideas are joined together. For example, “In 1918, ... whereas ... prefer to rent household moving towards till two decades” has unclear clause structure and tense, while “both figure were equal” shows an agreement error. The sentence beginning “in 1961” also shifts between constructions and does not clearly distinguish the two percentages. Capitalisation and punctuation are inconsistent, including lowercase sentence openings and the lack of a full stop at the end. Build comparisons in shorter, complete sentences, check subject–verb agreement and articles, and use past-tense forms consistently when reporting the historical data.
See this exact question answered at other band scores. The same prompt compared across bands.
Browse more IELTS Writing model answers or get your own writing scored by the same AI examiner.