Band 5.0 IELTS Writing Task 1 Model Answer
Overall Band Score: 5.0 · Cambridge IELTS 13 · 2026-11-12
IELTS Writing Task 1 question
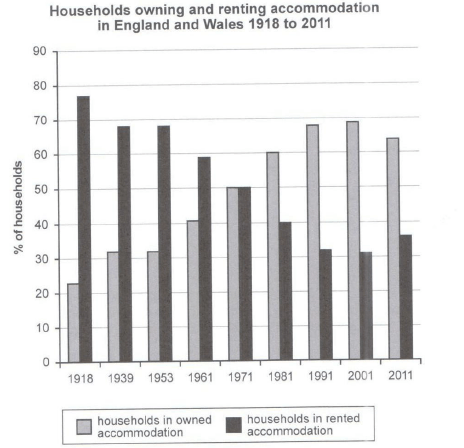
The chart below shows the percentage of households in owned and rented accommodation in England and Wales between 1918 and 2011.
Summarize the information by selecting and reporting the main features and make comparisons where relevant.
Student answer (Band 5.0)
The given bar graph represent the percentage accommodation of households in owned as well as accommodation of households in rented in England and surrounding areas between a time period of 93 years. Households in rented accommodation is slightly shows higher percentage rate as compare to households in owned accommodation.
In 1918 the households in owned accommodation increases to 75% whereas in 1939 and 1953 the accommodation rate is 68%. From 1981 to 2011 the percentage of households in owned accommodation is increases as well as decreases between 40 to 30.
The percentage of households in rented accommodation is two low in 1918 over 20%. In 1939 and 1953 accommodation is slightly similar like above 30%. In 1971 percentage of households in owned and rented accommodation is same, maximum 50%. Similarly accommodation in owned and rented portion is 40% in 1961 and 1981. From this we conclude that households in rented accommodation is higher in early years while households in owned accommodation is higher in last years.
AI examiner evaluation
| Criterion | Band |
|---|---|
| Task Achievement / Task Response | 4.5 |
| Coherence and Cohesion | 5.0 |
| Lexical Resource | 5.0 |
| Grammatical Range and Accuracy | 5.0 |
| Overall | 5.0 |
Task Achievement / Task Response: Band 4.5
The response identifies the broad contrast between renting in the earlier years and owning in the later years, and notes the equal 50% shares in 1971. However, several key figures are assigned to the wrong category: in 1918 ownership was about 23%, not 75%, and renting was about 77%; the 68% figures in 1939 and 1953 also refer to renting, not ownership. The description of 1981–2011 as ownership moving between 40% and 30% is inaccurate; ownership was around 60–69%, then fell to 64%. The overview is also unclear and the main long-term rise in ownership and fall in renting are not accurately reported. Select the dominant trends first, then support them with correctly matched figures.
Coherence and Cohesion: Band 5.0
There is some organisation: the response begins with an introduction, moves to selected years, and ends with a broad comparison between early and later periods. Linking expressions such as “Similarly” and “From this we conclude” help signal relationships. However, the progression is difficult to follow because the second and third paragraphs switch between owned and rented accommodation without a consistent sequence, and several comparisons are unclear—for example, “accommodation is slightly similar like above 30%.” The conclusion repeats a general contrast rather than drawing together the accurately described trends. Organise the body by series or by chronological stages, and use clear references so readers can tell which figures belong to each category.
Lexical Resource: Band 5.0
The response uses a small range of task-related vocabulary, including “percentage,” “households,” “owned,” and “rented,” so the topic is generally recognisable. However, wording is repetitive and several collocations or word choices are inaccurate, which sometimes makes the meaning difficult to interpret. Examples include “percentage accommodation,” “slightly shows higher percentage rate,” and “two low”; these do not express the intended comparisons naturally. “Surrounding areas” is also not an accurate substitute for England and Wales. Use precise chart language such as “the proportion of households,” “accounted for,” “rose,” “fell,” and “remained stable,” while repeating the category labels when needed for clarity.
Grammatical Range and Accuracy: Band 5.0
The response attempts both simple statements and longer comparisons, but grammatical control is inconsistent, and errors frequently affect clarity. For example, “The given bar graph represent” has subject–verb disagreement, while “Households in rented accommodation is slightly shows” combines incompatible verb forms. The sentence “the percentage … is increases” also uses an incorrect verb construction, and “In 1971 percentage … is same” lacks an article and has an awkward clause structure. Tense and agreement errors recur across the response, and some sentences are difficult to parse. Practise accurate present or past descriptions of chart data, subject–verb agreement, and complete comparison structures before attempting longer sentences.
See this exact question answered at other band scores. The same prompt compared across bands.
Browse more IELTS Writing model answers or get your own writing scored by the same AI examiner.