Band 5.0 IELTS Writing Task 1 Model Answer
Overall Band Score: 5.0 · Cambridge IELTS 13 · 2026-11-13
IELTS Writing Task 1 question
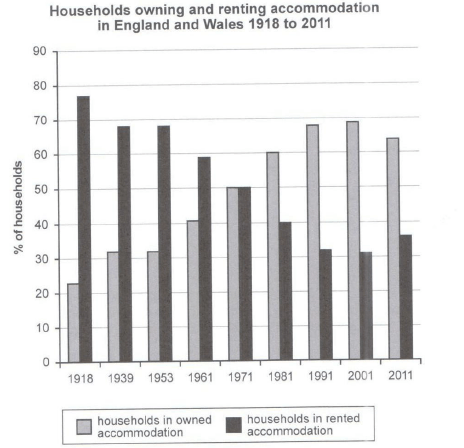
The chart below shows the percentage of households in owned and rented accommodation in England and Wales between 1918 and 2011.
Summarize the information by selecting and reporting the main features and make comparisons where relevant.
Student answer (Band 5.0)
The table chart presents the percentage of households in self owned and rented accommodation in two different countries England and Wales from 1918 to 2011.
As an overall, trend it is clear that the table charts shows the household owned and rented accommodation in England and Wales. In the table the vertical line shows the percentage of households and horizontal line shows the date .The percentage of rented households accommodation is higher than the owned households accommodation.
The percentage of rented accommodation is higher in 1918 and lower is in same time period and 75% of rented accommodation and 25% of owned accommodation.The percentage of both rented and owned accommodation slightly decreasing over a time . In 1971 the percentage of both rented and owned accommodation is eqall at 50 % .After that time period the percentage of owned accommodation is increasing and rented accommodation is decreasing .
In 1991 the percentage of owned and rented accommodation is 68 and 32 respectively.In 2011 the the percentage of owned accommodation is decreasing and rented accommodation also decreases to 35%.
AI examiner evaluation
| Criterion | Band |
|---|---|
| Task Achievement / Task Response | 5.0 |
| Coherence and Cohesion | 4.5 |
| Lexical Resource | 5.0 |
| Grammatical Range and Accuracy | 5.0 |
| Overall | 5.0 |
Task Achievement / Task Response: Band 5.0
You identify the two accommodation types and give a broad overview that ownership rises while renting generally falls, including the equal 50% point in 1971 and the 1991 figures. However, the account is only partially accurate and developed: you say renting is higher in 1918 at 75% and ownership 25%, rather than approximately 77% and 23%, and you describe both categories as decreasing over time. In fact, ownership rises through 2001 before falling in 2011, while renting follows the reverse pattern. The final sentence also says renting decreases to 35% in 2011, but it rises from 31% to about 36%. Select the main turning points and report them accurately to make the overview and comparisons clearer.
Coherence and Cohesion: Band 4.5
The response has separate paragraphs and a broadly chronological order, moving from an introduction and overview to selected years. Basic links such as “After that time period” and “In 1991” help the reader follow the sequence. However, progression is weakened by repetition: the overview restates that the chart shows ownership and renting, and the description repeats “the percentage of” without clearly grouping the long-term trend and key changes. Some connections are also confusing, particularly “The percentage of rented accommodation is higher in 1918 and lower is in same time period,” which does not clearly explain the comparison. Organise the body around the overall trend and the main turning points, and use clearer references and transitions between periods.
Lexical Resource: Band 5.0
You use relevant basic terms such as “percentage,” “owned,” “rented,” “increasing,” and “decreasing,” so the subject is generally understandable. However, the range is limited and several phrases are unnatural or imprecise, including “self owned,” “table chart,” and “rented households accommodation.” Repeated use of “percentage” and “accommodation” also makes the description less fluent. There are noticeable spelling and word-form errors, such as “eqall,” and “As an overall, trend” is not an appropriate expression. Use standard chart vocabulary and concise collocations—for example, “home ownership,” “rented accommodation,” and “the figures were equal”—to describe the data more naturally and precisely.
Grammatical Range and Accuracy: Band 5.0
You attempt both simple statements and longer sentences, and the reader can understand the main topic and several comparisons. However, the range is limited, and errors occur frequently in sentence construction, agreement, articles, and punctuation. For example, “the table charts shows” has a subject–verb agreement problem, while “In the table the vertical line shows…” lacks clear article and punctuation control. The sentence “The percentage of rented accommodation is higher in 1918 and lower is in same time period” is difficult to follow because its comparison is not grammatically formed. There are also awkward repeated structures such as “the percentage of both rented and owned accommodation.” Practise accurate comparative sentences and check agreement, articles, and sentence boundaries.
See this exact question answered at other band scores. The same prompt compared across bands.
Browse more IELTS Writing model answers or get your own writing scored by the same AI examiner.