Band 5.0 IELTS Writing Task 1 Model Answer
Overall Band Score: 5.0 · Cambridge IELTS 13 · 2026-11-15
IELTS Writing Task 1 question
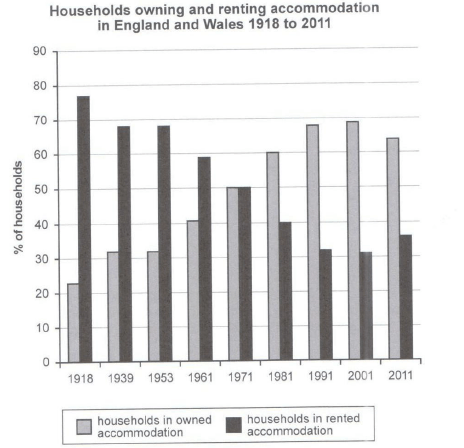
The chart below shows the percentage of households in owned and rented accommodation in England and Wales between 1918 and 2011.
Summarize the information by selecting and reporting the main features and make comparisons where relevant.
Student answer (Band 5.0)
The bar chart illustrate the households accommodation in two catageries in the England and Wales from 1918 to 2011 explain in percentages.
Overall, the average of rented houses gradually decreased every year .fourthermor, the demand of owned houses rosely grow up ,however, in the middle year both were remained stable.
In the begning , in the year of 1918 ,the demand of ranted houese highest therefore, the level of owned houses lowest poient the figer at almost up to 20%.
The years of 1953 to 1939 both parties similarly changed . 1961 the rented demand among low popularitly whereas , the interest of owned houses increase in majority of individuals.
In the year of 1971 the intereste both parties samed the percentages at the poient of 50%.finaly in 1981 to 2001 the demands of owned houses approched high rank however , rented houses became low interest. In addionally, in 2011 the percentage of ownered houses similarly down while the rented houses slowly up.
AI examiner evaluation
| Criterion | Band |
|---|---|
| Task Achievement / Task Response | 5.5 |
| Coherence and Cohesion | 5.0 |
| Lexical Resource | 5.0 |
| Grammatical Range and Accuracy | 5.0 |
| Overall | 5.0 |
Task Achievement / Task Response: Band 5.5
You identify the two categories and describe the broad opposing trends: ownership generally rises while renting falls, with both at 50% in 1971 and a reversal in 2011. These are relevant features. However, the overview is imprecise: ownership did not rise continuously, since it was unchanged at 32% from 1939 to 1953 and dipped from 69% in 2001 to 64% in 2011. The account also gives few accurate figures beyond the 1971 comparison, and some descriptions are unclear, such as “the years of 1953 to 1939 both parties similarly changed.” To strengthen the response, report key values and turning points accurately, and make the overall summary more precise rather than describing demand or interest, which the chart does not measure.
Coherence and Cohesion: Band 5.0
The response has a basic structure, moving from an introduction and overview to a chronological account, and time markers such as “In the beginning,” “In the year of 1971,” and “Finally” help indicate sequence. However, progression is not consistently clear. The sentence “The years of 1953 to 1939” reverses the dates, and the transition from 1961 to 1971 is difficult to follow. Linking words such as “however” and “additionally” are sometimes used awkwardly or without a clear relationship between ideas. Several sentences also combine multiple comparisons without clear punctuation. Organise the body into clearer stages—early years, the crossover, and later years—and use linking expressions only where they accurately show contrast or sequence.
Lexical Resource: Band 5.0
You use some relevant topic vocabulary, including “percentage,” “households,” “rented,” and “owned,” and attempt to describe change with words such as “decreased” and “increase.” However, the range is limited and several word choices or collocations make the meaning difficult to understand. For example, “the demand of owned houses rosely grow up” and “rented demand among low popularitly” do not describe the chart naturally; it shows proportions of households, not demand or popularity. Spelling errors such as “catageries,” “begning,” and “ranted” are also noticeable. Use precise chart language such as “the proportion of households,” “rose,” “fell,” “remained stable,” and “reached a peak,” and check spelling and word forms.
Grammatical Range and Accuracy: Band 5.0
You attempt both simple and more extended sentences, including an overview with contrast and a sentence comparing the two categories in 1971. However, grammatical control is inconsistent, and errors frequently make relationships between ideas hard to follow. Examples include “The bar chart illustrate,” where subject–verb agreement is missing, and “the demand of owned houses rosely grow up,” which has problems with verb form and sentence construction. Articles, plurals, and punctuation are also unreliable, as in “in the year of 1918 ,the demand of ranted houese highest.” Some sentences lack a clear main clause or use an unclear tense. Build accurate short sentences first, then combine them with controlled clauses; check agreement, past-tense verbs, articles, and sentence boundaries.
See this exact question answered at other band scores. The same prompt compared across bands.
Browse more IELTS Writing model answers or get your own writing scored by the same AI examiner.