Band 6.0 IELTS Writing Task 1 Model Answer
Overall Band Score: 6.0 · Cambridge IELTS 13 · 2026-11-16
IELTS Writing Task 1 question
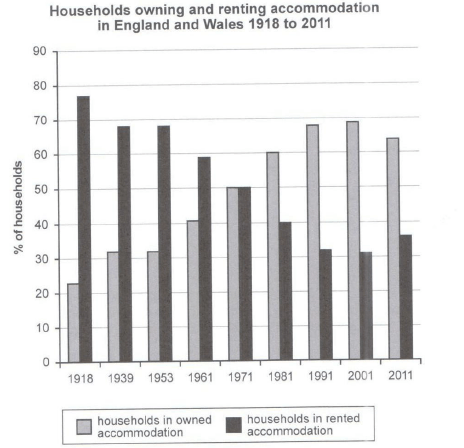
The chart below shows the percentage of households in owned and rented accommodation in England and Wales between 1918 and 2011.
Summarize the information by selecting and reporting the main features and make comparisons where relevant.
Student answer (Band 6.0)
The bar chartm illustrates the percentage of households in owned and rented accomodation in England and Wales from 1918 to 2011.
Overall, two categories are demonstrated in the picture, including households in owned accomodation and households in rented accomodation, with their distinct trends. The households in owned accomodation inclined persistently in entire 93 years, while the figure declined consistently in rented accomodations over the same period of time between 1918 and 2011.
To begin with households in owned accomodation, the figure has around 23 percent in 1918 that slightly inclined to 31 percent in both1939 and 1953. The households figure further went up to 40 percent in 1961, 50 percent in 1971 with 61 percent in 1981 along with 68 percent in both 1991 and 2001.The figure further drop a little dip to 64 percent in 2011.
Moreover, in rental accomodation, the households figure was 74 percent in 1918 that went down a little to 68 percent in 1939 and 1953 and then take a consistent declined onward.50 percent in 1971, 40 percent in 1981 with 31 percent in both 1991 and 2001. The household figure further inclined steadily to around 34 percent in 2011.
AI examiner evaluation
| Criterion | Band |
|---|---|
| Task Achievement / Task Response | 6.0 |
| Coherence and Cohesion | 6.0 |
| Lexical Resource | 5.5 |
| Grammatical Range and Accuracy | 5.5 |
| Overall | 6.0 |
Task Achievement / Task Response: Band 6.0
You identify the two categories and give a clear overview of their opposing long-term trends, then support it with figures across the period. Most reported values are close to the chart, including ownership at about 23% in 1918 and 68–69% in 1991 and 2001. However, the overview says ownership rose persistently and renting declined consistently, which misses the reversal in 2011: ownership fell to 64% while renting rose to 36%. The rental figure for 1918 is also given as 74%, rather than approximately 77%. These details make the account less fully accurate, and some stages are reported as a sequence of figures without highlighting the crossover at 50% in 1971. Include the late reversal in the overview and check key values.
Coherence and Cohesion: Band 6.0
The response has a coherent overall structure: an introduction, an overview, and separate paragraphs for ownership and renting. This makes the two series easy to follow, and phrases such as “To begin with” and “Moreover” signal the shift between them. However, the progression is sometimes mechanical, with repeated references to “the figure” and repeated use of “further.” Some sentence boundaries are unclear, particularly “2001.The figure” and “onward.50 percent,” which interrupt the flow. The overview also presents the trends as consistently moving in opposite directions, so it does not prepare the reader for the 2011 reversal described later. Use clearer sentence boundaries and connect the final change to the overview for smoother progression.
Lexical Resource: Band 5.5
You use enough topic vocabulary to describe the chart, including “percentage,” “households,” “owned,” “rented,” and “declined,” and the meaning is generally clear. There are, however, noticeable spelling and word-choice problems, such as “accomodation” and “bar chartm.” Several combinations are unnatural or imprecise: “the households in owned accommodation inclined” and “take a consistent declined onward.” “A little dip” is also awkward in “drop a little dip.” Repetition of “figure” and “further” limits the range of description. Aim for accurate, natural chart language, for example “the proportion of households that owned their homes rose” and “the rental share fell.” Check spelling and use verbs and nouns in their correct forms.
Grammatical Range and Accuracy: Band 5.5
You attempt both simple and more extended sentence forms, and the overall meaning can usually be understood. Some grammatical errors remain, especially in verb forms and sentence construction. For example, “the figure has around 23 percent” needs a past-tense reporting structure, while “that slightly inclined” does not form a clear clause; “then take a consistent declined” also has an incorrect verb pattern. Articles and number agreement are inconsistent in phrases such as “the households figure.” Punctuation creates further problems: there is no space after the full stops in “2001.The” and “onward.50,” and the latter separates a figure from its sentence. Use complete clauses with consistent past tense, and proofread punctuation to make the relationships between figures clear.
See this exact question answered at other band scores. The same prompt compared across bands.
Browse more IELTS Writing model answers or get your own writing scored by the same AI examiner.