Band 4.5 IELTS Writing Task 1 Model Answer
Overall Band Score: 4.5 · Cambridge IELTS 13 · 2026-11-17
IELTS Writing Task 1 question
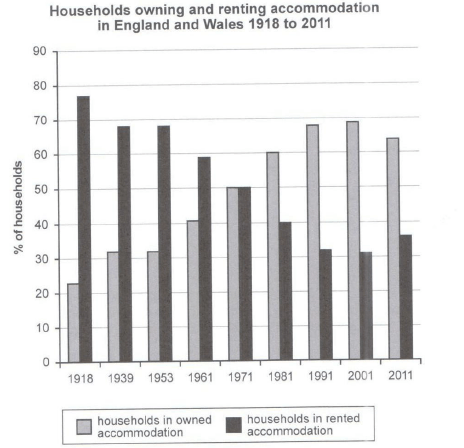
The chart below shows the percentage of households in owned and rented accommodation in England and Wales between 1918 and 2011.
Summarize the information by selecting and reporting the main features and make comparisons where relevant.
Student answer (Band 4.5)
The bar chart shows the percentage of households in owned and rented accommodation in England and Wales between 1918 and 2011.
Overall, households in owned accommodation started in 1918 at 22%, and rented accommodation was 78%.
The trend from 1918 to 1971 remained constant, and after that, the trend changed with the passage of time and rented accommodation increased day by day.
In addition, in 1981, owned houses decreased by 30% compared with rented houses. Furthermore, the number of rented houses rose steadily. In 1991, owned houses increased because of good employment and some other factors.
Additionally, paying rent can be difficult every month because of the rise and fall in job circumstances, so its better to own a personal house is good.
In conclusion, households in owning accommodation is increased by the passage of time and sharply decline in rented accommodations. It's convenient to try to own accommodation and live in relax mood.
AI examiner evaluation
| Criterion | Band |
|---|---|
| Task Achievement / Task Response | 3.5 |
| Coherence and Cohesion | 4.5 |
| Lexical Resource | 5.0 |
| Grammatical Range and Accuracy | 5.0 |
| Overall | 4.5 |
Task Achievement / Task Response: Band 3.5
The response identifies the chart topic and gives approximate starting figures (22% owned and 78% rented), which are close to the chart. However, the account misrepresents the main trends: the figures do not remain constant from 1918 to 1971, and rented accommodation does not increase after 1971. Ownership rises to a peak of about 69% in 2001 before falling, while renting follows the reverse pattern. The claims about employment and the benefits of owning a home are not shown by the chart and should be omitted. The response also contains only 136 words, below the required 150. To improve, provide a clear, accurate overview and select key comparisons across the period.
Coherence and Cohesion: Band 4.5
There is some basic organisation: an opening sentence introduces the chart, followed by a separate overview-like paragraph and a conclusion. Linking expressions such as “Overall,” “In addition,” and “Furthermore” show an attempt to connect ideas. However, progression is difficult to follow because the response moves between inaccurate chart descriptions and personal opinions about renting and home ownership. Some links do not express a clear relationship, and the conclusion repeats a broad claim rather than summarising the chart’s actual pattern. Group the information into a clear introduction, overview, and detail paragraphs, and use comparisons to guide the reader through the years. This would make the organisation more coherent and reduce reliance on mechanical connectors.
Lexical Resource: Band 5.0
The response uses enough basic vocabulary to identify the topic and describe change, including “percentage,” “increased,” “decreased,” and “steadily.” However, the range is limited and several choices are imprecise or unnatural for describing chart data. For example, “increased day by day” does not suit a chart with observations at separate years, while “owned houses” and “rented houses” are less accurate than referring to households or accommodation. “Live in relax mood” is also an awkward expression and is not relevant to reporting the data. Aim for precise trend language such as “rose gradually,” “reached a peak,” and “declined slightly,” and avoid unsupported explanations or conversational phrasing.
Grammatical Range and Accuracy: Band 5.0
The response includes some simple sentences and attempts longer structures, for example, “The trend from 1918 to 1971 remained constant, and after that, the trend changed…” However, grammatical control is uneven. The sentence “its better to own a personal house is good” combines structures incorrectly, and “households in owning accommodation is increased” has problems with noun form, agreement, and verb construction. There are also awkward sentence patterns that make relationships between ideas unclear. Use straightforward, complete sentences to report each trend, checking subject–verb agreement and verb forms. For example, write “The proportion of households owning their homes increased” rather than “households in owning accommodation is increased.”
See this exact question answered at other band scores. The same prompt compared across bands.
Browse more IELTS Writing model answers or get your own writing scored by the same AI examiner.