Band 5.0 IELTS Writing Task 1 Model Answer
Overall Band Score: 5.0 · Cambridge IELTS 13 · 2026-11-17
IELTS Writing Task 1 question
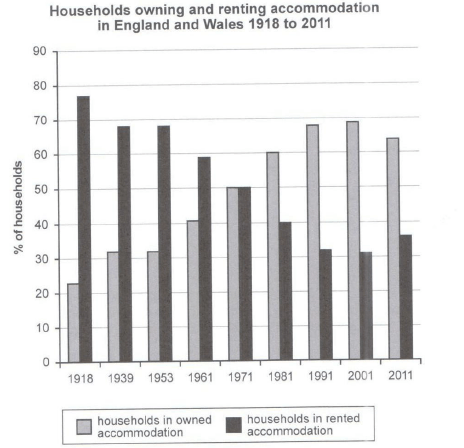
The chart below shows the percentage of households in owned and rented accommodation in England and Wales between 1918 and 2011.
Summarize the information by selecting and reporting the main features and make comparisons where relevant.
Student answer (Band 5.0)
the bar graph depicts the percentage of households in owned and rented accommodation in england and wales from start to end between 1918 and 2011 the x axis explains the years whereas y axis represents percentage the explanation is discussed below in the following essay
to begin with the year 1918 rented accodmmodation is at its peak at 77 percentage where as owned accommodation is the lowest at 22 percentage following that ,in the year 1939 rented accommodation was seen a slight decrese at 68 percentage and owned was at 33 percentage subsequent to that ,in the year 1953 both rented accommodation and owned was same like 1939 in 1961 there was a slight drop in in both rented at 57 and owned 40 in 1971 both was same there was no change in 1981 owned at 60 followed by ,rented was at 40 in 1991 there was a significant increase for owned and rented was dipt at 33 percentage in 2001the owned was at 68 and renetd was at 33 in 2011 it was at 65 and iwned was at 33
overall it is clear from all the perspective the highest owned was in the year 1991 and lowest was at 1918 the highest rented was at 1918 and lowest was at 1918
AI examiner evaluation
| Criterion | Band |
|---|---|
| Task Achievement / Task Response | 4.5 |
| Coherence and Cohesion | 5.5 |
| Lexical Resource | 5.0 |
| Grammatical Range and Accuracy | 4.5 |
| Overall | 5.0 |
Task Achievement / Task Response: Band 4.5
You identify both accommodation types and report several relevant figures, including the initial 77% rented and 22% owned, and the equal 50% shares in 1971. However, the account is only partially accurate: ownership rises to a peak of about 69% in 2001, not 1991, and renting reaches its lowest point in 2001, not 1918. The final-year figures are also reversed or misreported: in 2011 ownership is about 64% and renting 36%. The overview therefore gives incorrect extremes and misses the central pattern of ownership rising while renting generally falls, before both move slightly in the opposite direction after 2001. Select the main trends and check comparisons against the chart.
Coherence and Cohesion: Band 5.5
The response has a basic overall structure: an introduction, a chronological account, and a concluding overview. Time markers such as “to begin with,” “following that,” and “in 1991” help readers follow the sequence. However, the long middle paragraph strings many years and figures together, so comparisons between the two series are difficult to track. Some linking phrases are repetitive or awkward, and the conclusion repeats the idea of highest and lowest values without clearly summarising the overall trend. Grouping the early years and later years into separate paragraphs, and using clearer contrasts such as “whereas” or “by comparison,” would create more logical progression and make the relationships between the figures easier to understand.
Lexical Resource: Band 5.0
You use relevant topic vocabulary, including “percentage,” “owned accommodation,” “rented accommodation,” “increase,” and “drop,” so the subject is generally identifiable. However, the range is limited and several word-choice, spelling, and collocation errors make the report less precise: “at its peak” is not suitable for the 1918 rented figure when the series later changes, “dipt” is unclear, and “same like 1939” is unnatural. There are also misspellings such as “accodmmodation,” “decrese,” and “renetd.” Aim for accurate, neutral chart language and vary the verbs used to describe trends. Proofreading spelling and choosing standard collocations would make the information clearer.
Grammatical Range and Accuracy: Band 4.5
The response attempts to connect several events in longer sentences, but sentence structures are limited and control is inconsistent. For example, “in the year 1953 both rented accommodation and owned was same like 1939 in 1961…” joins separate comparisons without clear sentence boundaries, while “both was same” has an agreement error. Articles and prepositions are also often missing or misplaced, and punctuation is insufficient, particularly in the long sequence of years and figures. These problems sometimes make it difficult to see where one comparison ends and the next begins. Use shorter, complete sentences with a clear subject and verb, and check agreement, articles, and punctuation. A few accurately controlled complex sentences would add variety without sacrificing clarity.
See this exact question answered at other band scores. The same prompt compared across bands.
Browse more IELTS Writing model answers or get your own writing scored by the same AI examiner.