Band 5.0 IELTS Writing Task 1 Model Answer
Overall Band Score: 5.0 · Cambridge IELTS 13 · 2026-11-17
IELTS Writing Task 1 question
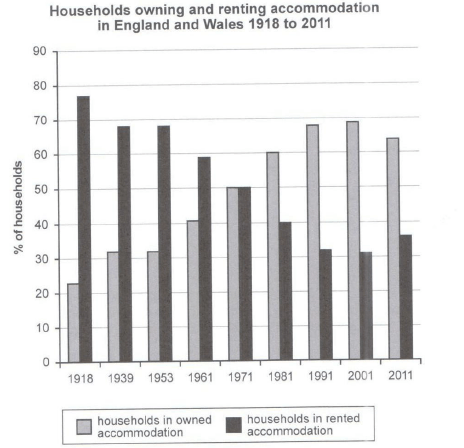
The chart below shows the percentage of households in owned and rented accommodation in England and Wales between 1918 and 2011.
Summarize the information by selecting and reporting the main features and make comparisons where relevant.
Student answer (Band 5.0)
The given bar chart represent the percentage of households owned and rented accommodation in England and wales in 1918 to 2011.
As we see in the bar, around 70 to 80percentage of people were living in rented accommodation in 1918. Where as 2001 was the higest percentage of people owned the household which is nearly about 70 percentage. As a time passes , the rented houshold show graduly downard trend where as owned accommodation show upward trend. Since 1971 was the year where both accommodation was equal to eachother.
From 1918 to 2001 there was a upward trend where people were buying own household as a accommodation. Instead of renting people decided to get there own house so from 20 percentage to near about 70 percentage jump was seen. There was a dastrict change in 1971 where both owner and rented accommodation show equal trend so there is no chnage in it.
As we can on the graph in 1918, owned household was less percentage but rented accommodation was the higest peek in that time. As a year pass, rented accommodation shows dastrict change so the number of percentage was decreassing by the time. In 1991 to 2001 , was the equal percentage which is around 30 to 40 perentage.
AI examiner evaluation
| Criterion | Band |
|---|---|
| Task Achievement / Task Response | 5.5 |
| Coherence and Cohesion | 4.5 |
| Lexical Resource | 5.0 |
| Grammatical Range and Accuracy | 5.0 |
| Overall | 5.0 |
Task Achievement / Task Response: Band 5.5
You identify the chart’s main contrast and broad movement: renting is highest at the start, ownership rises, and the two figures meet in 1971. You also note that ownership peaks around 2001. However, the account is only partly developed and includes an important misreading: the figures are percentages of households, not people, and the final sentence incorrectly suggests that renting was equal from 1991 to 2001. In fact, ownership is about 68–69% and renting about 31–32% in those years. The overview would be clearer if it stated that ownership generally rose before dipping in 2011, while renting followed the reverse pattern, and supported this with accurate comparisons across the period.
Coherence and Cohesion: Band 4.5
The response has some paragraphing and a broadly understandable order, moving from an opening description to trends and then examples. However, progression is weak because several points are repeated: the decline in renting and rise in ownership are mentioned more than once without adding much detail. Linking phrases such as “As a time passes” and “As we can on the graph” do not clearly connect the ideas, and “Where as” introduces fragments rather than complete comparisons. The final paragraph’s claim about 1991–2001 also disrupts the line of explanation. Group the information into a concise overview and a paragraph comparing key stages, using clear references and fewer repeated statements.
Lexical Resource: Band 5.0
You use some relevant chart vocabulary, including “percentage,” “upward trend,” “downward trend,” and “equal,” so the topic is generally identifiable. However, the range is limited and several word choices or collocations are inaccurate, such as “people were buying own household as a accommodation” and “equal trend.” Repetition of “percentage,” “accommodation,” and “trend” also makes the description less precise. Spelling errors—including “higest,” “graduly,” “dastrict,” and “decreassing”—are noticeable and can slow the reader. Use standard terms such as “households,” “home ownership,” “share,” and “fell,” and check spelling carefully to make comparisons clearer.
Grammatical Range and Accuracy: Band 5.0
The response attempts both simple and longer sentences, but control is inconsistent, and errors sometimes make relationships between ideas difficult to follow. For example, “The given bar chart represent” has subject–verb disagreement, while “Since 1971 was the year where both accommodation was equal” has an awkward clause structure and agreement error. Articles and plurals are also problematic in phrases such as “a upward trend” and “both accommodation.” Some sentences are fragments, including “Where as 2001 was the higest percentage…” and “Instead of renting people decided…,” which lacks clear punctuation. Practise complete comparison sentences and check agreement, articles, and punctuation; for example, “In 1971, the proportions of households owning and renting were equal.”
See this exact question answered at other band scores. The same prompt compared across bands.
Browse more IELTS Writing model answers or get your own writing scored by the same AI examiner.