Band 5.0 IELTS Writing Task 1 Model Answer
Overall Band Score: 5.0 · Cambridge IELTS 13 · 2026-11-18
IELTS Writing Task 1 question
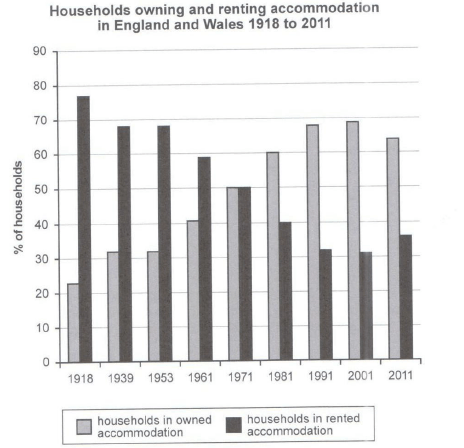
The chart below shows the percentage of households in owned and rented accommodation in England and Wales between 1918 and 2011.
Summarize the information by selecting and reporting the main features and make comparisons where relevant.
Student answer (Band 5.0)
The bar chart depicts the proportion of house holds in owned and rental accomodation in the two countries England and Wales between the year 1918 to 2011.
As per the information the highest hoseholds is owned for accomodation was in 2001 and it was about to 69% approximately, whilw the lowest accomodation was in 1918 and its upto 22%.Adding on this, there was inclining the ratio of households owned in accomodation,but the
households which was rented in accomodation was fluctuating from the year 1991 to 2011. It was slightly rise from the year 2011.
However, the percentage of households in rented accomodation was rise in the year 1918,while it was declined constantly and in the end of 2001 it was slightly rise for the rented households for the accomodation.
To summarise the bar chart, the both sides of the households which was owned or rented in accomodation was changed as same as we see in the diagram which had given to us.
AI examiner evaluation
| Criterion | Band |
|---|---|
| Task Achievement / Task Response | 4.5 |
| Coherence and Cohesion | 4.5 |
| Lexical Resource | 5.0 |
| Grammatical Range and Accuracy | 5.0 |
| Overall | 5.0 |
Task Achievement / Task Response: Band 4.5
You identify the chart’s subject and mention relevant extremes: ownership is lowest in 1918 at about 22% and reaches its peak in 2001 at roughly 69%. However, the main trends are not reported accurately or clearly enough. Ownership generally rises over the period, then falls to 64% in 2011; renting follows the opposite pattern, reaching a low in 2001 before rising to 36% in 2011. Your statement that renting “was rise in the year 1918” is unclear, and the claim that it fluctuated from 1991 to 2011 misses the clear fall and final increase. The overview that both sides “changed as same” does not explain the key comparison. Select and summarise the overall pattern, then support it with accurate stages and figures.
Coherence and Cohesion: Band 4.5
The response has an opening, several body paragraphs and a concluding sentence, so there is an attempt to organise the information. However, the ideas do not progress clearly from an overview to a comparison of the two series. The second paragraph moves between ownership and renting, while the next repeats the rented trend without clarifying its direction. Linking expressions such as “Adding on this” and “However” do not show the relationships between the points accurately, and references such as “it” and “both sides” are difficult to follow. A clearer structure would present the overall trend first, then describe ownership and renting together across the main turning points. Use fewer, more precise connectors and make each paragraph serve a distinct purpose.
Lexical Resource: Band 5.0
You use some relevant chart vocabulary, including “proportion,” “percentage,” “declined,” and “approximately,” which helps identify the type of information being described. However, the range is limited and several word choices or combinations are inaccurate, sometimes making the meaning difficult to understand. For example, “the highest hoseholds is owned for accomodation” and “the households which was rented in accomodation” are not natural ways to describe the data. “Inclining the ratio” is also an awkward choice for a rising percentage. Spelling errors such as “house holds,” “accomodation,” and “whilw” are noticeable. Practise accurate collocations for describing charts, such as “the proportion of households that owned their homes increased,” and check spelling before submitting.
Grammatical Range and Accuracy: Band 5.0
You attempt to combine ideas in longer sentences, for example with “while” and “which,” but these structures are often faulty, and the response relies heavily on simple or incomplete patterns. Errors in verb forms and agreement appear in phrases such as “the highest households is owned” and “the percentage … was rise.” Articles and sentence construction are also problematic in “the both sides of the households,” while punctuation is inconsistent, with missing spaces after full stops and commas. These errors sometimes make the intended trend hard to interpret. Build accuracy first with clear comparative sentences, such as “The proportion of owner-occupied homes rose from 23% in 1918 to 69% in 2001.” Then practise joining accurate clauses using “while” or “whereas.”
See this exact question answered at other band scores. The same prompt compared across bands.
Browse more IELTS Writing model answers or get your own writing scored by the same AI examiner.