Band 5.5 IELTS Writing Task 1 Model Answer
Overall Band Score: 5.5 · Cambridge IELTS 13 · 2026-11-18
IELTS Writing Task 1 question
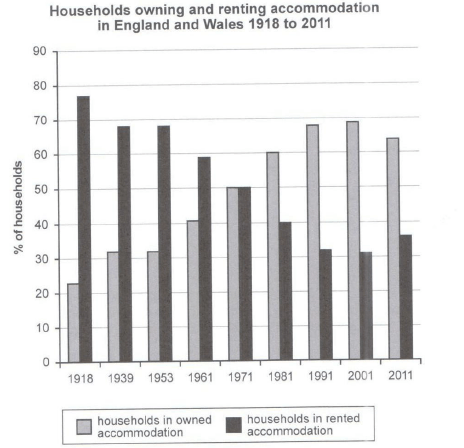
The chart below shows the percentage of households in owned and rented accommodation in England and Wales between 1918 and 2011.
Summarize the information by selecting and reporting the main features and make comparisons where relevant.
Student answer (Band 5.5)
The bar chart illustrates the percentages of householdsaccommodation owned and rented in England and Wales between 1918 and 2011.
Overall, the general information the chart shows was that people mostly prefer rented accommodation in 1918 but in 2011 most individulas like to live in the houses owned by them.
In 1918, households in owned accommodation was less than 30% and people mostly lived in rented houses.But gradually people started to own houses and the proportions of owned houses started to increase.In 1939 and 1953, the rate of both owned and rented houses remained the same and rented households was leading it.In 1961, percentage of rentd houses was less than 60% and owned houses was more than 40%.1971 was the year when both stood at the same percentage of 50% but in 1981, the households in owned accommodation started to led and decrease in rented accommodation started.After ten years to twenty years, the owned houses rate approaches to 69% but it did not goes to above than 70%.In 2011, downfall of owned houses started and went to 64%.
AI examiner evaluation
| Criterion | Band |
|---|---|
| Task Achievement / Task Response | 5.5 |
| Coherence and Cohesion | 5.5 |
| Lexical Resource | 5.5 |
| Grammatical Range and Accuracy | 5.0 |
| Overall | 5.5 |
Task Achievement / Task Response: Band 5.5
You identify the main contrast and broad change: renting was more common at the start, ownership rose, the two figures met in 1971, and ownership was higher by 2011. Several reported values are also broadly accurate, including the 50% crossover and the ownership peak of about 69% in 2001. However, the overview is imprecise: “most individuals like to live” describes preference rather than the chart’s household figures, and the 2011 statement does not mention that renting also rose to 36%. The account gives a year-by-year sequence but does not clearly summarise the long-term pattern or highlight the 2001 peak and subsequent reversal as a comparison. Focus on household proportions and select the most significant stages for a clearer, more complete summary.
Coherence and Cohesion: Band 5.5
The response has a recognisable overall order, moving from an overview into a chronological account, and time markers such as “In 1918,” “In 1961,” and “In 2011” help readers follow the data. However, the body is presented as one long paragraph, and the repeated year-by-year structure makes the progression feel like a list rather than a grouped comparison. Some links are unclear or awkward: “After ten years to twenty years” does not specify the period clearly, while “but in 1981” joins the crossover and later change without a precise relationship. Separate the overview from two body paragraphs and group the early decline in renting with the later rise in ownership, then describe the peak and reversal. This would make the organisation more coherent and cohesion less mechanical.
Lexical Resource: Band 5.5
You use relevant topic vocabulary, including “percentages,” “proportions,” “owned accommodation,” and “rented houses,” so the main subject is generally understandable. There is some attempt to vary wording, but several choices are inaccurate or unnatural for describing chart data. “People mostly prefer” suggests a stated preference, while “the rate of both owned and rented houses” is not a natural way to describe household shares. “Downfall” is too dramatic for a modest decline, and “approaches to 69%” is an awkward collocation. Spelling slips such as “individulas” and “rentd” also reduce control. Use precise terms such as “share,” “proportion,” “accounted for,” and “peaked at,” and keep the wording focused on households rather than people’s preferences.
Grammatical Range and Accuracy: Band 5.0
The response attempts both simple and more extended sentences, including clauses linked with “but” and “when,” and the intended timeline is usually understandable. However, errors are frequent enough to make some sentences awkward or difficult to process. For example, “households in owned accommodation was” has subject–verb disagreement, and “rented households was leading it” has the same problem. Verb forms are also faulty in “started to led” and “it did not goes”; use “started to lead” and “did not go.” There are also missing spaces after full stops and inconsistent sentence boundaries, as in “houses.But gradually.” Practise accurate agreement and verb patterns, and proofread punctuation. More reliable control of these basic forms would make your comparisons clearer.
See this exact question answered at other band scores. The same prompt compared across bands.
Browse more IELTS Writing model answers or get your own writing scored by the same AI examiner.