Band 4.5 IELTS Writing Task 1 Model Answer
Overall Band Score: 4.5 · Cambridge IELTS 13 · 2026-11-18
IELTS Writing Task 1 question
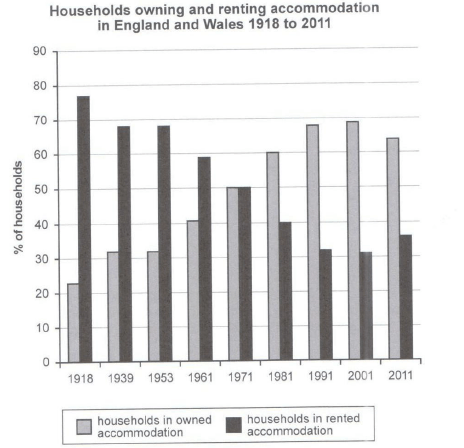
The chart below shows the percentage of households in owned and rented accommodation in England and Wales between 1918 and 2011.
Summarize the information by selecting and reporting the main features and make comparisons where relevant.
Student answer (Band 4.5)
The given graph illustrates the percentage of the house furniture in owned and rented accomodation in the region of England and Wales from the period of 1918 to 2011 .
The highest rate of household was in 1918 in rented houses which was about 78 %, but the least was for the owned houses at the rate of 21% in that year . The rate in both kinds of the accomodations like rentd and the owned ones was similar in 1971 at about 50 % rate of householeds.
The given chart shows the different rates of the house holds in the year of 1918 to 2011 for different kinds of accomodations . The rates were increased at highest of 78% in rented houses but decreased down at 21% in the same time in buyed accomodations and both of them went at same rat of 50% in the year of 1971.
AI examiner evaluation
| Criterion | Band |
|---|---|
| Task Achievement / Task Response | 4.5 |
| Coherence and Cohesion | 4.0 |
| Lexical Resource | 5.0 |
| Grammatical Range and Accuracy | 5.0 |
| Overall | 4.5 |
Task Achievement / Task Response: Band 4.5
You identify the chart’s subject and report two relevant features: renting was highest at the start, and ownership and renting reached about 50% each in 1971. The figures you give for 1918 are close to the chart. However, the response does not summarise the main pattern across 1918–2011: ownership generally rose to a peak around 2001 before falling, while renting followed the opposite trend. The repeated focus on 1918 and 1971 leaves most of the timeline unreported, and there is no clear overview of the overall changes. Some wording also makes the trend difficult to interpret, such as saying rates “increased at highest” in rented houses. Select the major turning points and describe the full-period contrast more clearly.
Coherence and Cohesion: Band 4.0
There is some basic organisation: the opening identifies the chart, and the following paragraphs mention figures and a comparison. However, the response does not develop in a clear sequence. The second and third paragraphs largely repeat the same information about 1918 and the equal figures in 1971, while the intervening years and later changes are omitted. Connections between ideas are also unclear in phrases such as “but the least was for the owned houses” and “decreased down at 21%,” which make it hard to follow what is being compared. Group the information into an overview and a chronological account of the main changes, and use clear references to ownership and renting rather than repeating the same points.
Lexical Resource: Band 5.0
The response uses some relevant topic vocabulary, including “percentage,” “owned,” “rented,” “rate,” and “accommodation,” so the subject is generally recognisable. However, the range is limited and several word choices or collocations are inaccurate or awkward: “house furniture” does not describe households, “buyed accommodations” is unsuitable, and “rates increased at highest” is unclear. There are also noticeable spelling errors, including “accomodation,” “rentd,” and “householeds.” These problems sometimes make the intended meaning difficult to understand. Use precise chart language such as “proportion of households,” “home ownership,” and “rented accommodation,” and check spelling and collocations carefully.
Grammatical Range and Accuracy: Band 5.0
You attempt to form longer sentences and make comparisons, for example, “The rate in both kinds of the accomodations … was similar in 1971.” However, the range of sentence structures is limited, and attempts to connect several ideas often produce faulty or unclear sentences. In “The rates were increased at highest … but decreased down … and both of them went at same rat,” the verb forms and sentence construction obscure the relationship between the figures. Articles and plural forms are also inconsistent, as in “the highest rate of household” and “the house holds.” Full stops are separated from the preceding words by spaces, and the repeated sentence patterns restrict clarity. Practise accurate simple comparisons before combining them into longer sentences.
See this exact question answered at other band scores. The same prompt compared across bands.
Browse more IELTS Writing model answers or get your own writing scored by the same AI examiner.