Band 6.0 IELTS Writing Task 1 Model Answer
Overall Band Score: 6.0 · Cambridge IELTS 13 · 2026-11-19
IELTS Writing Task 1 question
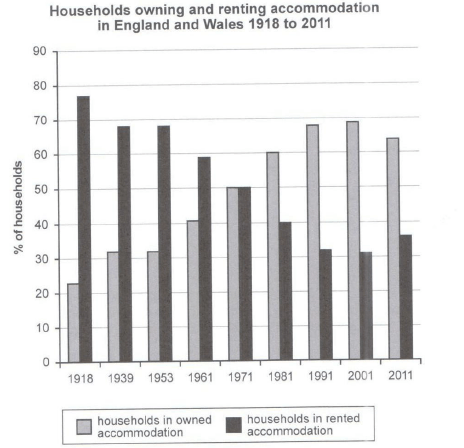
The chart below shows the percentage of households in owned and rented accommodation in England and Wales between 1918 and 2011.
Summarize the information by selecting and reporting the main features and make comparisons where relevant.
Student answer (Band 6.0)
The chart below illustrates the percentage of households in owned and rented accommodation in England and Wales from 1918 to 2011.
Overall, the number of maximum rented households was in 1918 whereas the minimum in 2001 and the maximum amount of owned households was in 2001 and minimum in 1918.
In 1918, the households in rented accommodation were maximum whereas the number of owned households was minimum. Rented households accommodation declined to about 68 percent in 1939 but the percentage of owned households inclined to about 32 percent and both of these remained constant till 1953. In 1961, households in owned accomodation increased to about 40 percent and rented households accomodation fell to approximately 59 percent. In 1971, both were at same level of about 50 percent.
Households in owned accommodation accounted for 60 percent and rented households made up to 40 percent in 1981. In 1991, owned households accommodation constitued to about 68 percent and rented house of about 33 percent. In 2001, owned households accommodation reached to its maximum of about 70 percent whereas rented accommodation to its minimum value of about 32 percent which then rose to approximately 36 percent in 2011 and the owned households percentage made up to 63 percent in 2011.
AI examiner evaluation
| Criterion | Band |
|---|---|
| Task Achievement / Task Response | 6.5 |
| Coherence and Cohesion | 6.0 |
| Lexical Resource | 6.0 |
| Grammatical Range and Accuracy | 5.5 |
| Overall | 6.0 |
Task Achievement / Task Response: Band 6.5
You cover the full period and report the main opposing trends: ownership generally rises while renting falls, they meet at about 50% in 1971, and both change direction slightly by 2011. Most figures are consistent with the chart, including the 1939–1953 plateau and the 2001 peak in ownership. The overview identifies the extremes, although it would be clearer to describe the overall shift from renting to ownership rather than repeat the maximum and minimum points. Some details are less precise: ownership in 2001 is about 69%, not exactly 70%, and the 2011 figure is about 64%, rather than 63%; these are small differences. To strengthen the response further, make the overview more analytical and distinguish the later reversal from the long-term trend.
Coherence and Cohesion: Band 6.0
The response has a clear overall arrangement: an introduction, an overview, and chronological details. The sequence from 1918 to 2011 makes the figures easy to follow, and time markers such as “In 1961” and “In 1971” help orient the reader. However, the overview repeats the opening comparison in the next paragraph, and several sentences use similar patterns, making the progression somewhat mechanical. The repeated phrase “households in owned accommodation” also weighs down the later section. Grouping the early years and later years into two focused paragraphs, while using concise references such as “the ownership figure” and “the rental share,” would improve flow and cohesion.
Lexical Resource: Band 6.0
You use an adequate range of task-related vocabulary, including “declined,” “remained constant,” “increased,” and “accounted for,” so the main trends are generally clear. There are also attempts at more formal reporting language. However, several choices are inaccurate or unnatural: “the number of maximum rented households” and “maximum amount” do not fit percentage data, while “inclined to” is not the right verb for a rise. Phrases such as “rented households accommodation” and “reached to its maximum” also show weak collocation. Spelling errors in “accomodation” and “constitued” further reduce accuracy. Prefer precise terms such as “proportion,” “share,” “peaked,” and “fell to,” and avoid repeating the full category labels.
Grammatical Range and Accuracy: Band 5.5
You attempt both simple and more complex sentence forms, including clauses linked with “whereas” and “which then rose,” and the chronological account is usually understandable. Some grammatical errors remain, however. The overview’s “whereas the minimum in 2001” lacks a verb, and “the maximum amount of owned households was in 2001 and minimum in 1918” has an incomplete parallel structure. In “rented households made up to 40 percent,” the verb pattern is incorrect; use “made up 40 percent.” There are also awkward article and preposition patterns, as in “at same level” and “reached to its maximum.” Aim to make comparisons in complete, parallel clauses and check articles and verb patterns; this would improve accuracy while preserving your range of sentence structures.
See this exact question answered at other band scores. The same prompt compared across bands.
Browse more IELTS Writing model answers or get your own writing scored by the same AI examiner.