Band 6.0 IELTS Writing Task 1 Model Answer
Overall Band Score: 6.0 · Cambridge IELTS 13 · 2026-11-19
IELTS Writing Task 1 question
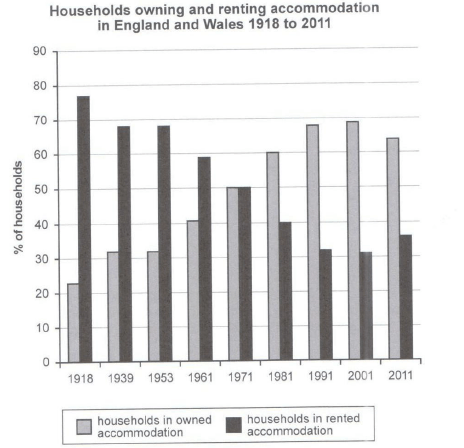
The chart below shows the percentage of households in owned and rented accommodation in England and Wales between 1918 and 2011.
Summarize the information by selecting and reporting the main features and make comparisons where relevant.
Student answer (Band 6.0)
Information about number of households in owned and rented domes in England and Wales in the period of 1918 to 2011 is depicted by the given bar graph.
Overall, as the years passed, one can get to know that people were getting more fund of owning accomodations than renting it. At the one year, same number of people owned and rented houses.
Scrutinizing deeper into bar graph, people owning the accomodation showed the upward trends over the years. In the year 1918, only 22% of people owned houses, whereas 78% of people rented their accomodations. We can notice the downward trend in the percentage of people renting houses, but in the year 2011, there was again increase in the percentage of people renting accomdations which is approx 35%.
By analysing more, till 1961 number of people owning houses was less than the number of people renting house. In 1971, there was the ratio of people who owned houses and the one who rented houses was 50:50. Percentage of people owning houses reach at it's peak in the year 2001 which is almost 70%. In 2001, one can notice the lowest point in the number of people renting house which is only 30%
Hereby, I conclude my report..
AI examiner evaluation
| Criterion | Band |
|---|---|
| Task Achievement / Task Response | 6.5 |
| Coherence and Cohesion | 6.5 |
| Lexical Resource | 5.5 |
| Grammatical Range and Accuracy | 5.5 |
| Overall | 6.0 |
Task Achievement / Task Response: Band 6.5
You identify the main overall shift from renting to owning and report several relevant figures, including the equal 50% shares in 1971 and the ownership high and rental low in 2001. The figures you give are broadly consistent with the chart, including the rise in renting by 2011. This covers the key pattern, but some points are imprecise or under-developed: “At the one year” does not identify 1971, and the overview could state more clearly that ownership rose while renting fell for most of the period before both moved in the opposite direction after 2001. Also, the chart shows households, not individual people. A more precise overview and clearer comparison of the final years would strengthen the report.
Coherence and Cohesion: Band 6.5
The response has a recognisable structure, with an introduction, an overview and paragraphs describing the trends and key years. The sequence from the early figures to the crossover and 2001 peak is generally understandable. However, progression is weakened by formulaic transitions such as “Scrutinizing deeper,” “By analysing more,” and “Hereby, I conclude my report,” which do not add useful links and make the report sound less natural. The overview’s “At the one year” is also unclear as a reference, and the final conclusion repeats rather than synthesises the information. Organise the body around the long-term trend and the turning points, and use concise links such as “By 1971” or “After 2001” to make relationships explicit.
Lexical Resource: Band 5.5
You use relevant task vocabulary, including “upward trends,” “downward trend,” “percentage,” and “peak,” so the main information can be understood. However, several word choices and collocations are inaccurate or unnatural: “more fund of owning” does not express the intended increase in preference, “domes” is not the correct term, and “number of people” is unsuitable when the chart measures households. There are also spelling errors in “accomodation,” “accomdations,” and “accomodations.” Repetition of “people owning houses” and “renting houses” limits flexibility. Learn and consistently use the chart’s terms—“households,” “owner-occupied accommodation,” and “rented accommodation”—and check spelling before submitting.
Grammatical Range and Accuracy: Band 5.5
You attempt a mix of simple and more complex sentences, including a contrast with “whereas” and a time clause beginning “By analysing more.” The main trends remain understandable, but some grammatical errors affect clarity and control. For example, “At the one year” has an unclear time expression, “the ratio … was 50:50” is awkwardly constructed, and “Percentage … reach at it's peak” has problems with the verb form, article, and possessive. The sentence beginning “We can notice” also shifts into an informal first-person construction. Practise accurate past-tense reporting and sentence patterns such as “The proportion of households owning homes reached its peak,” while checking articles, agreement, and punctuation.
See this exact question answered at other band scores. The same prompt compared across bands.
Browse more IELTS Writing model answers or get your own writing scored by the same AI examiner.