Band 5.5 IELTS Writing Task 1 Model Answer
Overall Band Score: 5.5 · Cambridge IELTS 13 · 2026-11-19
IELTS Writing Task 1 question
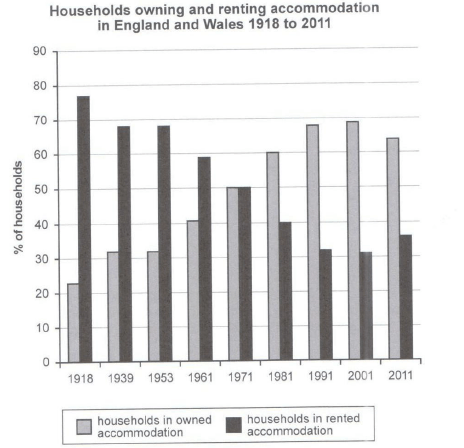
The chart below shows the percentage of households in owned and rented accommodation in England and Wales between 1918 and 2011.
Summarize the information by selecting and reporting the main features and make comparisons where relevant.
Student answer (Band 5.5)
The chart demonstrate the ratio of resendential living in owned or rented houses in england and wales in the year 1981 and 2011.
Overall, it was evident that the highest trend in both the countries was households in rented accommodation in the year of 1918. Whereas the minimum figure of owned house hold was also shown in the same year.
Looking into details, initially the citizen of both the countries were mostly living in rented house the highest trend was in 1918 at 75%. While as the time passes the percentage decrease over 65% in 1953. it was clearly shown in the chart that the percentage gradually decline in every passing year, eventually reaching 31% in 2001. And then again after 10 years it slightly increase with 32%.
Futhermore, In 1918 the lowest number was recorded 22% for owned accommodation in that year people prefer to live more in rented house. The percentage of the people living in their own accomodation increased steadily over the years. in 1939 it start arise with 32% then goes to 50% in 1971 and somewhere the graphs shows the same percentage level in two year 1991 and 2001 at 65%. after 10 years of analyzation it was noticed the percentage ended up with 62% in 2011 for there owned house. to sum up people in both countries perfer to but there own accomoda
AI examiner evaluation
| Criterion | Band |
|---|---|
| Task Achievement / Task Response | 6.0 |
| Coherence and Cohesion | 5.5 |
| Lexical Resource | 5.0 |
| Grammatical Range and Accuracy | 5.0 |
| Overall | 5.5 |
Task Achievement / Task Response: Band 6.0
You identify the main contrast correctly: renting was more common at the beginning, while ownership rose over time and became the larger category. You also include several relevant figures, such as 23% ownership in 1918 and 50% in 1971. However, some details are inaccurate: the rented figure in 1953 was 68%, not “over 65%” as a decline from the earlier level suggests, and it was 36% in 2011, not 32%. Ownership reached 68% in 1991 and 69% in 2001, rather than 65% in both years. The opening also refers to 1981 and 2011, although the chart covers the full period from 1918 to 2011. A clearer overview of the crossover in 1971 and the slight reversal after 2001 would make the key features more complete and precise.
Coherence and Cohesion: Band 5.5
The response has a recognisable structure, with an introduction, an overview and separate paragraphs describing rented and owned accommodation. This gives the reader a basic route through the information. However, progression within the detail paragraphs is sometimes difficult to follow because several ideas are joined in long, loosely punctuated sentences, for example, “the citizen … were mostly living in rented house the highest trend was in 1918.” Linking expressions such as “Whereas,” “While as,” and “Furthermore” are not always used to show the relationship between ideas accurately, and the final sentence is incomplete. Organise each paragraph around a clear chronological sequence, use full stops to separate comparisons, and make references to the two accommodation types explicit. This would make the overall arrangement more coherent and cohesion less mechanical.
Lexical Resource: Band 5.0
You use some task-relevant vocabulary, including “percentage,” “accommodation,” “increased steadily,” and “recorded,” and the reader can generally identify the two categories being compared. However, the range is limited and several choices are unnatural or imprecise: “highest trend” is used for a percentage value, “resendential living” is unclear, and “the percentage decrease over 65%” does not express the intended change clearly. There are also noticeable spelling errors, including “Futhermore,” “accomodation,” and “analyzation,” as well as repeated forms such as “people prefer.” Choose precise chart language such as “proportion,” “figure,” “rose,” and “fell,” and check spelling and collocations carefully. More accurate vocabulary would make the comparisons easier to understand.
Grammatical Range and Accuracy: Band 5.0
You attempt both simple and more extended sentence forms, including time clauses such as “after 10 years” and a contrast introduced by “Whereas.” However, control is uneven, and errors in sentence boundaries, agreement, articles and verb forms sometimes make the meaning harder to follow. For example, “The chart demonstrate” needs subject–verb agreement, while “the percentage gradually decline” needs a past-tense verb. The sentence beginning “Looking into details” runs several clauses together without clear punctuation, and “in 1939 it start arise” has an unclear and grammatically faulty verb construction. Use past tense consistently for this historical data, check singular and plural agreement, and divide long sentences into complete clauses. These changes would improve accuracy while allowing you to retain a mix of sentence structures.
See this exact question answered at other band scores. The same prompt compared across bands.
Browse more IELTS Writing model answers or get your own writing scored by the same AI examiner.