Band 5.5 IELTS Writing Task 1 Model Answer
Overall Band Score: 5.5 · Cambridge IELTS 13 · 2026-11-19
IELTS Writing Task 1 question
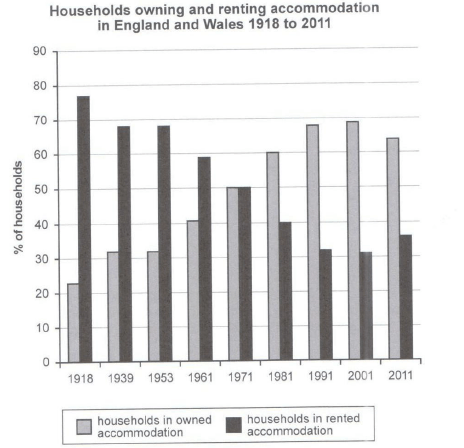
The chart below shows the percentage of households in owned and rented accommodation in England and Wales between 1918 and 2011.
Summarize the information by selecting and reporting the main features and make comparisons where relevant.
Student answer (Band 5.5)
In this bar chart we are going to compair the households owning and renting accommodation in england and wales for year 1918 to 2011.
The bar chart starts from year 1918 and goes on till 2011, with seperate yearly Interval between years.In which we can see that the households owning gradually kept increasing and households renting kept decreasing.
First off all we will compair the year 1918, [redacted phone] and 1961.In the year 1918 the household owing were very low almost 22% to 23% and the household renting is very high almost 78% to 79%, after 21 yeras we see in year 1939 that the households owning increased by almost 9% i.e 31% and the hose hold renting decreased by 9% i.e 69%.After 14 years in year 1953 we can see that the households owning kept same as the previous data of 1939 and the households renting also kept same 69% no change can be seen in this data.Now almost after 8 years in the year 1961 the households owning gradually increased almost 41% and the households renting kept decreasing almost 59%.
Now we compair the years 1971,1981,1991,2001 and 2011.In these years we can see that we have 10 years of yearly interval between all years.Now in the year 1971 we see that the households owning and renting are both equal almost 50%, after that in year 1981 we suddenly see a derastic change.The households owning increased almost 60% and the households renting decreased 40%.After that in year 1991 the households owning kept increasing 68% and households renting decreased almost 31%.After that in year 2001 we see that the households owning only decreased by 1% i.e 69% and households renting i.e 32%.Now in year 2011 we see that the hoseholds owning decreased slightly and the households renting increased slightly as well almost 36%.
AI examiner evaluation
| Criterion | Band |
|---|---|
| Task Achievement / Task Response | 5.5 |
| Coherence and Cohesion | 6.0 |
| Lexical Resource | 5.5 |
| Grammatical Range and Accuracy | 5.0 |
| Overall | 5.5 |
Task Achievement / Task Response: Band 5.5
You identify the chart’s main contrast and broad pattern: ownership generally rises while renting falls, and the two are equal in 1971. You also report several figures accurately, including 41%/59% in 1961 and 68% ownership in 1991. However, the overview is incomplete because it does not clearly highlight the later peak in ownership at about 69% in 2001 and the reversal by 2011, when ownership falls to 64% and renting rises to 36%. Some details are inaccurate: renting in 1918 was about 77%, not 78–79%, and in 2001 it was about 31%, not 32%. The response reports many points but gives limited emphasis to the most significant overall features; a sharper overview and more precise comparisons would strengthen it.
Coherence and Cohesion: Band 6.0
The response has a clear overall arrangement, moving chronologically through the earlier and later years, and the paragraph break helps distinguish these stages. Linking expressions such as “after that” and “in the year” make the sequence understandable. However, the organisation is driven mainly by listing each year rather than grouping the data around meaningful trends. Repeated transitions such as “Now” and “After that” make the progression mechanical, while the opening repeats the chart’s time span without adding much. The final section also says ownership “only decreased by 1%” in 2001, although it had increased slightly from 1991, which weakens the clarity of the comparison. Grouping the rise, plateau, crossover and final reversal would create a more purposeful progression.
Lexical Resource: Band 5.5
You use relevant topic vocabulary, including “households,” “owning,” “renting,” “increased,” “decreased” and “slightly,” so the main information remains understandable. However, the range is limited and several expressions are repeated, especially “we can see” and “kept increasing/decreasing.” Some choices are imprecise or unsuitable for a formal report: “suddenly” overstates the change between 1971 and 1981, and “yearly interval” does not accurately describe the uneven gaps between the earlier dates. Spelling errors such as “compair,” “seperate” and “derastic” are noticeable and reduce control. Use more precise trend language and vary the verbs—for example, describe ownership as “rose,” “levelled off” and later “declined,” while renting followed the opposite pattern.
Grammatical Range and Accuracy: Band 5.0
You attempt both simple statements and longer sentences with time clauses, such as “after 14 years in year 1953 we can see…,” showing some effort to vary sentence structure. However, complex sentences are often awkwardly formed, and errors recur in articles, agreement and sentence boundaries. For example, “the household owning were very low” has a singular/plural mismatch, while “the households owning and renting are both equal” uses an unclear construction and an inconsistent tense for past data. Several sentences run together without adequate punctuation, particularly the sequence beginning “After that in year 1981…”. Establish a consistent past tense, use clear subjects such as “the proportion of households,” and divide long sequences into controlled sentences. These changes would make the relationships between figures easier to follow.
See this exact question answered at other band scores. The same prompt compared across bands.
Browse more IELTS Writing model answers or get your own writing scored by the same AI examiner.