Band 5.5 IELTS Writing Task 1 Model Answer
Overall Band Score: 5.5 · Cambridge IELTS 13 · 2026-11-20
IELTS Writing Task 1 question
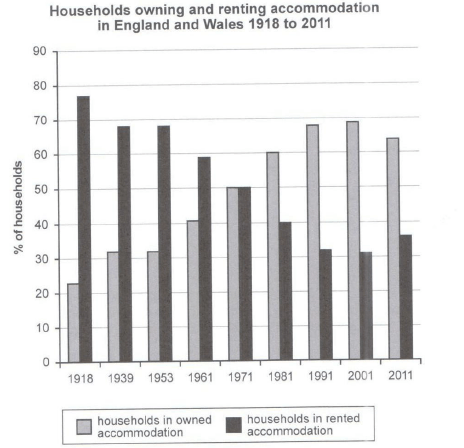
The chart below shows the percentage of households in owned and rented accommodation in England and Wales between 1918 and 2011.
Summarize the information by selecting and reporting the main features and make comparisons where relevant.
Student answer (Band 5.5)
The graph illustrates the proportion of residents in owned and rented accommodation in Britian and Wales between 1918 and 2011.
Overall, households in owned accommodation increased significantly and houses in rented accommodation are decreased dramatically.
Firstly, 1918 rented accommodation are nearly 80% and owned households stood at 20%. However, in 1939 and 1953 leased households was approximately 70% and homes owned by residents are 30%. In 1971, both private and house on rents have a proportion of 50%. Moreover, in 1961 rented accommodation are at 70% and privately houses have 40%.
Nextly, in 2011 the owner occupied homes reached its peak value which was between 60% and 70% whereas, tenanted homes at 40%. In 1918, least proportion of purchased houses which is 20% and 1981 it 60%.
In conclusion, proportion of purchased houses commenced from 20% and ended at 60%. However, rented households started from 80% and finished at 40%.
AI examiner evaluation
| Criterion | Band |
|---|---|
| Task Achievement / Task Response | 5.5 |
| Coherence and Cohesion | 5.0 |
| Lexical Resource | 5.5 |
| Grammatical Range and Accuracy | 5.0 |
| Overall | 5.5 |
Task Achievement / Task Response: Band 5.5
You identify the two accommodation types and give a broad overview of the opposing trends, which is relevant to the chart. However, the overview is not fully accurate: ownership rose to a high of about 69% in 2001, then fell to 64% in 2011, rather than reaching its peak in 2011. Several figures are also misreported or unclear: rented accommodation was about 59% in 1961, not 70%, and the final values were approximately 64% owned and 36% rented, not 60% and 40%. The response includes some key stages, but the account is limited and the conclusion repeats rounded starting and ending figures without capturing the 2001 turning point. Select the main comparisons more carefully and report the peak and final change accurately.
Coherence and Cohesion: Band 5.0
The response has a basic structure, with an opening, an overview, and paragraphs describing figures, so the reader can recognise the intended stages of a report. However, progression is uneven: the paragraph beginning “Firstly” moves from 1918 to 1939 and 1953, then jumps to 1971 before returning to 1961. “Nextly” introduces 2011, but the following sentence goes back to 1918 and 1981. This makes the chronology difficult to follow. Linking words such as “However,” “Moreover,” and “In conclusion” are used, but some do not clarify the relationship between the data. Organise the details in chronological order or group the early and later periods, and use transitions that signal comparisons or changes accurately.
Lexical Resource: Band 5.5
You use a range of relevant terms, including “proportion,” “accommodation,” “leased,” and “tenanted,” and the reader can generally understand the topic. However, some choices are unnatural or imprecise for describing this chart. “Britian” is misspelled, “Nextly” is not an appropriate transition, and “houses on rents” and “privately houses” are awkward formulations. “Peak value” is also used for 2011 even though the highest ownership figure occurred earlier. Repeated alternatives such as “purchased houses,” “owner occupied homes,” and “homes owned by residents” make the terminology less consistent. Prefer standard chart language such as “home ownership,” “rented households,” “rose,” and “fell,” and use the same labels consistently.
Grammatical Range and Accuracy: Band 5.0
The response attempts both simple and more extended sentences, including a contrast introduced by “However” and a relative clause in “which was between 60% and 70%.” Nevertheless, grammatical errors occur frequently and sometimes make the data descriptions harder to interpret. Examples include “rented accommodation are,” “leased households was,” and “it 60%,” which show problems with agreement and missing verbs. The phrase “both private and house on rents have a proportion” is also structurally unclear, and punctuation around “whereas” is faulty. Practise forming complete sentences with a clear subject and verb, checking singular and plural agreement, and using past-tense verbs consistently when reporting the historical figures.
See this exact question answered at other band scores. The same prompt compared across bands.
Browse more IELTS Writing model answers or get your own writing scored by the same AI examiner.