Band 5.0 IELTS Writing Task 1 Model Answer
Overall Band Score: 5.0 · Cambridge IELTS 13 · 2026-11-21
IELTS Writing Task 1 question
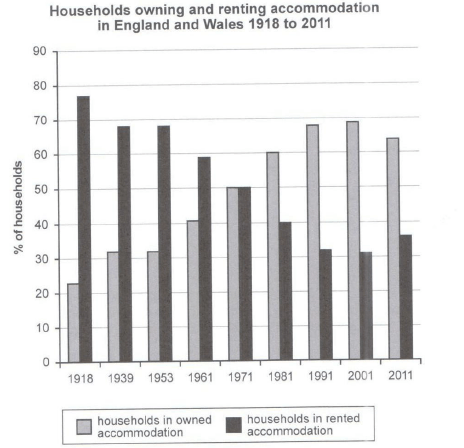
The chart below shows the percentage of households in owned and rented accommodation in England and Wales between 1918 and 2011.
Summarize the information by selecting and reporting the main features and make comparisons where relevant.
Student answer (Band 5.0)
The bar chart illustrates the percentage of households in owned and rented accommodation in england and wales between 1918 and 2011.
Overall, it is clear that the most popular accommodation is owned households and the least popular accommodation is rented households.
In start 1918 the rentend households 70+% and households owned accommodation is 22% and in 1971 rentend housedolds and owned householdes accommodation is equal 50% and the next year 1981 owned householdes accommodation increase 10% and rentend householdes accommodation decreased 10% and the next two years 1991, 2001 owend households accommodation increased and increased and the rented households accommodation decreased and the last year 2011 owned household accommodation 60%+ and rented households accommodation 30%+.
In comparisons both accommodation in start most popular accommodation is rentend households and the last year decreased and the owned households accommodation in start the low and the last year the increased .
AI examiner evaluation
| Criterion | Band |
|---|---|
| Task Achievement / Task Response | 5.0 |
| Coherence and Cohesion | 5.5 |
| Lexical Resource | 5.0 |
| Grammatical Range and Accuracy | 5.0 |
| Overall | 5.0 |
Task Achievement / Task Response: Band 5.0
You identify the chart’s subject and mention relevant points, including the equal 50% shares in 1971 and the rise in ownership after that. However, the overview is inaccurate: ownership was not the most popular throughout the period; renting was higher at the beginning, and the two categories were equal in 1971. Some figures are broadly right, but the final ownership figure is about 64%, not simply “60%+,” and the account of the later years is vague. The response is also below the required 150 words: 131 words, with 17 words copied from the prompt excluded. Add a clearer overview and select key figures to support the main trends.
Coherence and Cohesion: Band 5.5
There is some organisation: you begin with an introduction, provide an overview, and then describe changes over time. The chronological sequence and phrases such as “in 1971” and “the last year” help the reader follow the chart. However, the response does not progress clearly from a reliable overview to well-grouped comparisons. The long third sentence strings together several years and changes, while the final paragraph repeats the starting-versus-ending comparison without adding much. Linking phrases such as “the next year” are also unclear when referring to a decade. Use separate paragraphs for the overview and the main trends, and group the early and later periods more logically.
Lexical Resource: Band 5.0
You use relevant chart vocabulary, including “percentage,” “accommodation,” “increased,” and “decreased,” so the topic is generally recognisable. However, the range is limited and several expressions are repeated or inaccurately formed, such as “owned households accommodation” and “rentend households.” These errors sometimes make the intended meaning harder to understand. Phrases such as “most popular accommodation” are also imprecise for describing proportions of households. Choose concise terms such as “home ownership” and “rented accommodation,” and use accurate trend language, for example, “the proportion of owner-occupied homes rose.” Check spelling carefully and avoid repeating “households accommodation” throughout.
Grammatical Range and Accuracy: Band 5.0
The response attempts both simple statements and longer sentences, and the opening sentence communicates the chart’s subject. However, the range is limited, and the longer sentence beginning “In start 1918” contains several clauses joined without clear grammatical control. There are frequent problems with articles, word order, agreement, and verb forms, as in “the rentend households 70+%” and “the next year 1981 owned householdes accommodation increase 10%.” These errors can make relationships between figures difficult to follow. Practise writing short, complete comparison sentences with a clear subject and verb, such as “Ownership rose to 60% in 1981, while renting fell to 40%.”
See this exact question answered at other band scores. The same prompt compared across bands.
Browse more IELTS Writing model answers or get your own writing scored by the same AI examiner.