Band 5.5 IELTS Writing Task 1 Model Answer
Overall Band Score: 5.5 · Cambridge IELTS 13 · 2026-11-22
IELTS Writing Task 1 question
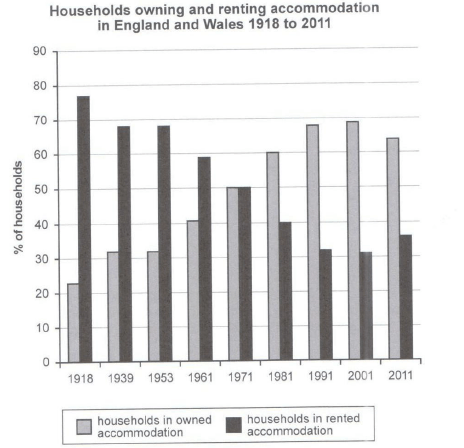
The chart below shows the percentage of households in owned and rented accommodation in England and Wales between 1918 and 2011.
Summarize the information by selecting and reporting the main features and make comparisons where relevant.
Student answer (Band 5.5)
The bar chart shows the households percentage in the rented and owned accomodation in the England and Wales between 1918 and 2011. There are two key features listing rented and owned accomodation. The comparison between the main features are given as there is the pecentage given in these accomodations.
The percentage household in rented accomodation shows the height in the year of 1918 as compared to owned accomodation. But there is a gradual low down seen in this accomodation as from [redacted phone]. In 1918 the rented department shows the highness of approximately 80% in the early years. In 1939 and 1953 it remains constand. This steady concentration is gone down in the year of 1961 which is about 60% overall. It goes on downfall in every year since 2011 shows an opposite direction.
There is an equality showed in both the accomodations in the year of 1971 which is exactly 50%.
Comparing toward the owned accomodation the percentage shows a gradual increase in the features. The accomodation goes on increase since 1918 to 2011. As it starts from the 20% in the starting years and in the 1939 it shows a sudden rise which is more than 30% and remains constant in 1953 and than remains increasing throughout the years. But in the year of 2011 it shows a sudden change as it decreases from its peak value of 70% TO 65% approximately which is an estimated value.
AI examiner evaluation
| Criterion | Band |
|---|---|
| Task Achievement / Task Response | 5.5 |
| Coherence and Cohesion | 5.5 |
| Lexical Resource | 5.0 |
| Grammatical Range and Accuracy | 5.0 |
| Overall | 5.5 |
Task Achievement / Task Response: Band 5.5
You identify the two categories and report several important features: renting starts much higher, the figures meet at 50% in 1971, and ownership generally rises before falling by 2011. Most figures are broadly consistent with the chart, including the approximate starting and ending values. However, the overview is not clearly stated; the opening mainly says that a comparison is given rather than summarising the overall pattern. The claim that renting continues to fall “in every year” is also inaccurate, since it rises from about 31% in 2001 to 36% in 2011. The main trends are relevant, but some are described imprecisely and the final-year reversal in both series needs clearer emphasis. A concise overview and more accurate comparisons would make the response more complete.
Coherence and Cohesion: Band 5.5
The response has a basic structure: an introduction, a paragraph on rented accommodation, a sentence about the point of equality, and a paragraph on ownership. This gives the reader some sense of how the information is grouped. However, progression is uneven, and several links between ideas are unclear. For example, “It goes on downfall in every year since 2011 shows an opposite direction” is difficult to follow and does not clearly connect the trend to the chart. Repeated references to “accommodation” and “percentage” also make the account feel repetitive, while “Comparing toward” does not establish a clear comparison. Organise the two series around a clear overview, then use accurate time references and linking phrases to show how their trends relate.
Lexical Resource: Band 5.0
You use some task-relevant vocabulary, including “gradual,” “remains constant,” “increase,” and “peak value,” so the reader can recognise the intended trends. However, the range is limited and several word choices or collocations are inaccurate enough to make parts difficult to understand. Phrases such as “gradual low down,” “the highness,” “steady concentration,” and “goes on downfall” are not natural ways to describe chart data. There are also noticeable spelling errors, including “accomodation,” “pecentage,” and “constand.” Use standard trend language consistently—for example, “declined,” “remained stable,” and “reached a peak”—and check spelling and collocations before submitting.
Grammatical Range and Accuracy: Band 5.0
The response attempts both simple and longer sentence forms, and some basic statements communicate the data, such as “There is an equality showed in both the accomodations in the year of 1971.” However, many sentences contain errors in structure, agreement, tense, or articles, and these sometimes obscure the intended meaning. For instance, “The percentage household in rented accomodation shows the height” has an unclear noun structure, while “It goes on downfall in every year since 2011 shows an opposite direction” combines clauses without a workable grammatical connection. The sentence beginning “As it starts from the 20%” is also an incomplete dependent clause. Practise forming complete sentences with a clear subject and verb, and use past-tense reporting consistently when describing the historical data.
See this exact question answered at other band scores. The same prompt compared across bands.
Browse more IELTS Writing model answers or get your own writing scored by the same AI examiner.