Band 4.5 IELTS Writing Task 1 Model Answer
Overall Band Score: 4.5 · Cambridge IELTS 13 · 2026-11-22
IELTS Writing Task 1 question
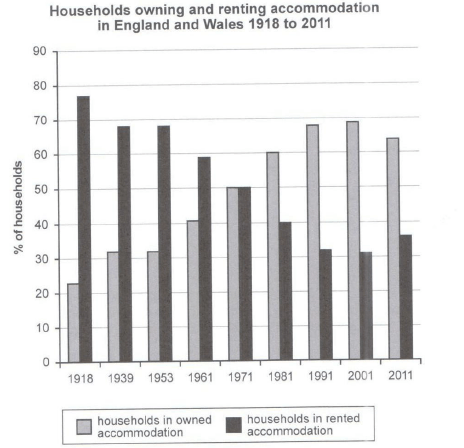
The chart below shows the percentage of households in owned and rented accommodation in England and Wales between 1918 and 2011.
Summarize the information by selecting and reporting the main features and make comparisons where relevant.
Student answer (Band 4.5)
The bar chart illustrates the percentage of households in owned and rented accomodation in England and wales in 1981 and 2011.
Overall, it is clear that the highest number of people living in rented accommodation and it saw a considereble decreased in the end of the period. While people were more interested to live in their own accomodation.and recorded a significant growth over the period.
In terms of accomodation In 1918 households in rented were recorded at its peak of 78%.while people who lived in own house is accounted just 22%.which is the lowest figure throughout the period.and it saw a significant growth over the period.in 1939 rose at 31% and people who lived in rented houses saw a decemt fall at 9% in the same year.
For the remaining figures these 2 categorie
AI examiner evaluation
| Criterion | Band |
|---|---|
| Task Achievement / Task Response | 4.0 |
| Coherence and Cohesion | 3.5 |
| Lexical Resource | 5.0 |
| Grammatical Range and Accuracy | 4.5 |
| Overall | 4.5 |
Task Achievement / Task Response: Band 4.0
The response identifies the broad contrast between ownership and renting and gives approximate figures for 1918 and 1939, which are close to the chart. However, it does not adequately summarise the full period: the opening incorrectly limits the chart to 1981 and 2011, and the final paragraph breaks off before reporting the remaining years. The overview is also unclear and partly inaccurate: renting starts at its highest level, but it does not simply decrease to the end, since it rises from 31% in 2001 to 36% in 2011; ownership likewise peaks in 2001 before falling. The response is 24 words below the 150-word minimum. To improve, complete the comparison across all years and state the main turning points accurately.
Coherence and Cohesion: Band 3.5
There is an attempt to organise the response into an introduction, an overview and a detail paragraph, and phrases such as “Overall” and “In terms of” signal the intended stages. However, progression is difficult to follow because the introduction names only two years, the overview contains unclear statements, and the final paragraph ends mid-sentence (“these 2 categorie”). Several ideas are joined with full stops in ways that leave fragments, while “and” is used repeatedly to connect points. The reader therefore cannot see a complete, logically ordered account of the chart. Use one paragraph for the overall trends and separate, complete paragraphs for the early and later figures, with clear links between comparisons.
Lexical Resource: Band 5.0
The response uses some relevant chart vocabulary, including “percentage,” “peak,” “lowest figure,” “growth” and “fall,” showing an attempt to describe trends rather than merely list values. However, the range is limited and several choices are inaccurate or awkward for this task: “highest number of people” refers to a number rather than a percentage, and “people were more interested” suggests motivation that the chart does not show. There are also noticeable spelling errors, including “accomodation,” “considereble” and “decemt,” which reduce the accuracy of the writing. Aim for precise terms such as “proportion of households,” “ownership rate” and “declined,” and check spelling before submitting.
Grammatical Range and Accuracy: Band 4.5
The response attempts some longer structures, including the contrast beginning “While people were more interested…” and the comparison of the two accommodation types in 1918. However, sentence control is weak: “it is clear that the highest number of people living in rented accommodation” has no complete main clause, and “which is the lowest figure throughout the period” is a fragment. Verb forms and agreement are also unreliable, as in “it saw a considereble decreased” and “people who lived in own house is accounted.” Punctuation and sentence boundaries cause further problems, for example the full stop before “and recorded” and the run-on sequence around the 1918 figures. Practise complete subject–verb clauses and use accurate past-tense forms when reporting the chart.
See this exact question answered at other band scores. The same prompt compared across bands.
Browse more IELTS Writing model answers or get your own writing scored by the same AI examiner.