Band 6.0 IELTS Writing Task 1 Model Answer
Overall Band Score: 6.0 · Cambridge IELTS 13 · 2026-11-06
IELTS Writing Task 1 question
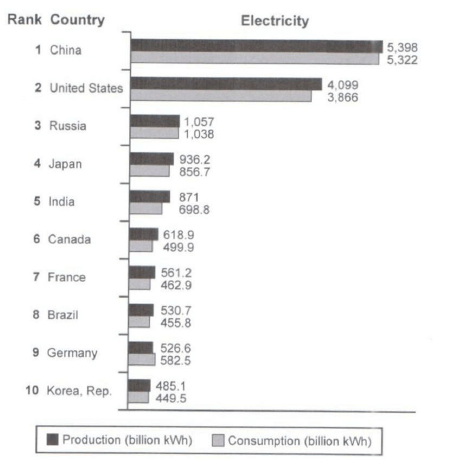
The bar chart below shows the top ten countries for the production and consumption of electricity in 2014.
Summarize the information by selecting and reporting the main features, and make comparisons where relevant.
Student answer (Band 6.0)
The bar chart illustrates the ten best countries responsible for producing and using electricity in year of 2014. The measurement is given in billion kWh.
Overall, China is the largest source of producing electricity and usage rate is also high among all other courtries. United Sates placed on second position for both consumption and production while other countries contribute a specific percentages.
In 2014, China produced around 5398 billion kWh and used around 5322 billion kwh whereas USA produced about 4099 billion kWh and used 3866 billion kWh of it's production. Russia as well margined it's production and usage rage maintainig a balance. In 2014, Japan and India contributed in electricity production with 936.2 billion kWh and 871 billion kWh and the consumptions are 856.7 billion kwh and 698.8 billion kWh. Rest five countries Canada, France, Brazil, Germany and Korea rep. produced around 500 billion kWh slightly up and down and their consumption rate is nearly same and within 500 billion kWh. From the bar chart it is noticible that each of the coutries consumption is within their production except for Germany which has a production of 526.6 billion kWh and used 582.5 billion kWh.
AI examiner evaluation
| Criterion | Band |
|---|---|
| Task Achievement / Task Response | 6.0 |
| Coherence and Cohesion | 6.0 |
| Lexical Resource | 5.5 |
| Grammatical Range and Accuracy | 5.5 |
| Overall | 6.0 |
Task Achievement / Task Response: Band 6.0
You identify the main leaders accurately: China and the United States rank first and second in both production and consumption, and you note the important exception that Germany consumes more than it produces. The figures given for China, the US, Japan and India are also accurate. However, the overview is vague when it says other countries “contribute a specific percentages,” and the grouping of the remaining five countries as producing around 500 billion kWh overlooks Canada’s higher production of 618.9. Russia’s figures are not reported, and the claim that the other countries’ consumption is “nearly same” obscures meaningful differences, especially Germany. A clearer overview and more selective comparisons would make the key features more fully developed.
Coherence and Cohesion: Band 6.0
The response has a clear overall arrangement: an introduction, an overview, and a paragraph of supporting figures. Its progression from the two leading countries to the middle-ranked countries and then the Germany exception is generally easy to follow. Some links between ideas are less clear, however. The phrase “while other countries contribute a specific percentages” does not explain the comparison, and “Rest five countries” groups several figures without a clear organising principle. The final sentence repeats the production-versus-consumption comparison rather than extending the overview. Use more precise grouping, such as comparing Russia separately and then summarising the lower-producing countries, and make references such as “their consumption” unambiguous.
Lexical Resource: Band 5.5
You use relevant task vocabulary, including “produced,” “consumption,” “measurement,” and “billion kWh,” so the chart is understandable. There are also attempts at more formal phrasing, such as “illustrates” and “contributed.” However, several choices are inaccurate or unnatural: “largest source of producing electricity,” “usage rate,” “margined,” and “consumption rate” do not express the comparisons precisely. “Specific percentages” is also unsuitable because the chart reports quantities, not percentages. Spelling errors such as “courtries,” “noticible,” and “coutries,” along with inconsistent forms such as “kwh,” reduce accuracy. Aim for standard collocations such as “generated the most electricity” and “consumed less than it produced.”
Grammatical Range and Accuracy: Band 5.5
You use a mixture of simple statements and longer sentences, and most of the data remains understandable. Some grammatical errors occur in sentence construction and possessives. For example, “in year of 2014” needs an article and a more natural time phrase, while “it's production” uses the contraction instead of the possessive “its.” The sentence beginning “Russia as well margined…” is difficult to parse, and “Japan and India contributed in electricity production” has an incorrect preposition pattern. There are also awkward structures in “each of the coutries consumption is within their production.” Practise accurate article use, possessives, and comparison structures; clearer sentence boundaries would help you express the figures without losing control of longer sentences.
See this exact question answered at other band scores. The same prompt compared across bands.
Browse more IELTS Writing model answers or get your own writing scored by the same AI examiner.