Band 4.5 IELTS Writing Task 1 Model Answer
Overall Band Score: 4.5 · Cambridge IELTS 13 · 2026-11-08
IELTS Writing Task 1 question
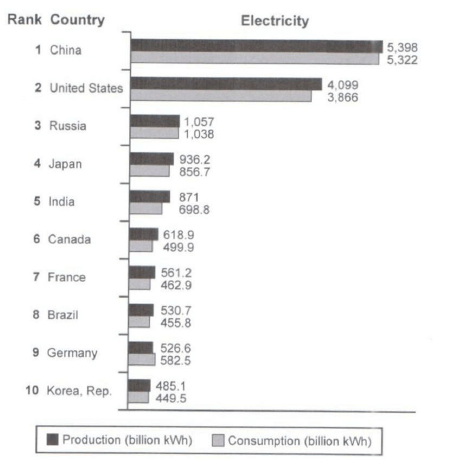
The bar chart below shows the top ten countries for the production and consumption of electricity in 2014.
Summarize the information by selecting and reporting the main features, and make comparisons where relevant.
Student answer (Band 4.5)
The bar chart illustrates information about top ten countries. We discuss about the production and consumtion of electricity in 2014. All these information in the form of kWh.
Overall, Top ten ranking country production and consumption of electricity.China produce 5,398 billion kWh electricity and Consumption 5,322 billion kWh. United States production 4,099 billion kWh of electricity and Consumption 3,866 billion kWh. Russia production 1,057 billion kWh and Consumption1,038 billion kWh of electricity. Japan produce 936.2 billion kWh and consumption to 856.7 billion kWh. India produce 871 billion kWh and consum 698.8 billion kWh. Canada produce 618.9 billion kWh and consum 499.9 billion kWh.
France produce 561.2 billion kWh and consum 462.9 billion kWh. Brazil produce 530.7 billion kWh and consum 455.8 billion kWh. Germany produce 526.6 billion kWh and cosum 582.5 billion kWh. Korea produce 485.1 billion kwh and cosum to 449.5 billion kWh according to the given bar chart.
AI examiner evaluation
| Criterion | Band |
|---|---|
| Task Achievement / Task Response | 4.5 |
| Coherence and Cohesion | 4.5 |
| Lexical Resource | 5.0 |
| Grammatical Range and Accuracy | 4.5 |
| Overall | 4.5 |
Task Achievement / Task Response: Band 4.5
You report figures for all ten countries, and most are accurate, including China, the United States, and Russia. You also capture the important contrast that Germany’s consumption (582.5) exceeds its production (526.6), unlike most of the other countries. However, the response is mainly a list of data rather than a summary of the main features. The opening overview, “Overall, Top ten ranking country production and consumption,” does not identify the key pattern: China and the United States lead by a large margin, while the remaining countries produce and consume much less. Add a clear overview and select a few representative comparisons instead of giving every figure.
Coherence and Cohesion: Band 4.5
The response follows a broadly understandable order, moving from the largest producers to the smaller ones, and the country-by-country format makes individual figures relatively easy to locate. However, the opening and overview do not establish a clear progression of ideas, and nearly all the information is placed in one long paragraph. The repeated pattern of naming a country and listing two values makes the report read like an inventory rather than a connected summary. Use separate paragraphs for an introduction, an overview, and grouped comparisons. Linking phrases such as “By contrast” for Germany and “The figures for the other countries were considerably lower” would help show relationships between the data.
Lexical Resource: Band 5.0
You use relevant task vocabulary, including “production,” “consumption,” “billion kWh,” and “bar chart,” so the topic remains clear. However, the range is limited and several words are repeated throughout, especially “produce” and “consum.” There are also spelling and word-form errors such as “consumtion,” “cosum,” and “kwh,” as well as awkward phrases like “All these information.” These choices sometimes make the report less natural, even though the intended meaning is usually recoverable. Build a small range of accurate reporting verbs and comparison phrases, and check spelling and standard forms before finishing.
Grammatical Range and Accuracy: Band 4.5
Most of the response uses short, simple statements, and the figures can generally be understood. However, the range of sentence structures is very limited, and frequent errors affect accuracy. For example, “China produce” and “Japan produce” need subject–verb agreement, while “We discuss about” is an unsuitable construction for describing a chart. The opening also contains incomplete or poorly formed sentences, including “All these information in the form of kWh” and “Overall, Top ten ranking country production and consumption of electricity.” Punctuation and spacing are inconsistent, as in “Consumption1,038.” Practise complete sentences with accurate present-tense reporting verbs, and combine related figures using controlled comparison clauses.
See this exact question answered at other band scores. The same prompt compared across bands.
Browse more IELTS Writing model answers or get your own writing scored by the same AI examiner.