Band 5.5 IELTS Writing Task 1 Model Answer
Overall Band Score: 5.5 · Cambridge IELTS 13 · 2026-11-08
IELTS Writing Task 1 question
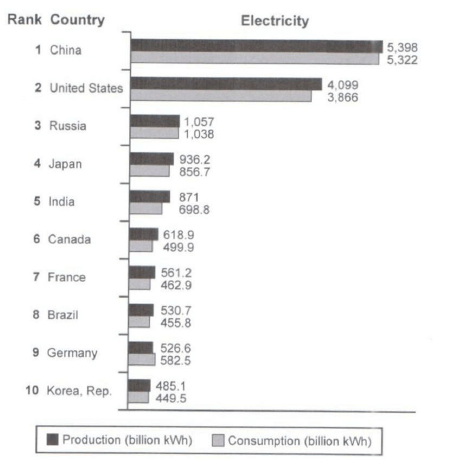
The bar chart below shows the top ten countries for the production and consumption of electricity in 2014.
Summarize the information by selecting and reporting the main features, and make comparisons where relevant.
Student answer (Band 5.5)
The bar chart illustrates the top ten countries for the production and consumption of electricity in 2014.
Overall China is the most popular country in terms of production and consumption of electricity. While Korea represented the smallest figure.
China was recorded the highest proportiont for using and generating electricity. Around 5,398 kWh was generated by China in 2014 and the consumption rate was 5,322. Followed by United States, the production rate was 4,099 and usage was almost 3,866 making it the second largest country.
Turning to remaning countries, In 2014 production and consumtion rate of
Russia was 1,057 and 1,038 which was higher than Japan at 936.32 and 856.7 respectively. Furthermore, the the figure of India was 871 and 698.8 which was slightly higher than Canda at 618.9 and 499.9. Whereas, the proportion of France was 561.2 and 462.6. Followed by Brazil at 530.7 and 455.8 respectively. In contrast, Germany and Korea were the smallest figure. The rate of genearating electricity was 526. and the figure for usage was 582.5, compared with Korea the figure were 485.1 and 449.5. Korea was the lowest figure among all.
AI examiner evaluation
| Criterion | Band |
|---|---|
| Task Achievement / Task Response | 5.5 |
| Coherence and Cohesion | 5.5 |
| Lexical Resource | 5.5 |
| Grammatical Range and Accuracy | 5.0 |
| Overall | 5.5 |
Task Achievement / Task Response: Band 5.5
You identify the chart’s subject and give a clear overview that China leads in both measures, while Korea is among the lowest. You also report many relevant figures and comparisons, including China, the United States, Russia, Japan, India and Canada. However, the overview is incomplete: Germany’s consumption (582.5) is higher than its production (526.6), and Germany is not the smallest in both measures. Some figures are inaccurate or incomplete: Japan’s production is 936.2, not 936.32; France’s consumption is 462.9, not 462.6; and Germany’s production is given as 526. without the final digit. Select the main contrasts more carefully and check figures against the chart.
Coherence and Cohesion: Band 5.5
The response has a recognisable structure: an introduction, an overview, and paragraphs comparing the largest countries with the remaining entries. This helps the reader follow the broad pattern. However, progression within the final paragraph is uneven, as several countries and figures are packed into one long sequence. Linking phrases such as “Furthermore,” “Whereas,” and “In contrast” are sometimes used mechanically or do not clearly signal the relationship between the data. The sentence beginning “Turning to remaining countries” also breaks awkwardly across a line. Group the figures into clearer comparisons—for example, Russia through India, then the lower-ranked countries—and use linking words only where they express a precise contrast or addition.
Lexical Resource: Band 5.5
You use relevant chart vocabulary, including “production,” “consumption,” “generated,” “usage,” and “highest,” so the topic is generally clear. There is some attempt to vary wording, but several choices are inaccurate or unnatural for describing data: “most popular country” suggests preference rather than output, and “highest proportion” is not suitable for these absolute figures. Spelling errors such as “remaning,” “consumtion,” “Canda,” and “genearating” are noticeable, while “smallest figure” is repeated. Use precise terms such as “largest producer,” “highest output,” and “lowest consumption,” and proofread spelling. More accurate collocations and less repetition would make the comparisons clearer and more natural.
Grammatical Range and Accuracy: Band 5.0
You attempt some complex structures, including “While Korea represented…” and comparisons introduced by “which was higher than…”. However, sentence control is inconsistent, and several structures are incomplete or faulty. “China was recorded the highest proportiont” lacks a natural passive construction, while “Followed by United States, the production rate was…” is an awkward fragment-like opening. Articles and sentence boundaries also need attention, as in “the the figure” and the capitalised “In” after a comma. Some long sentences combine multiple figures without clear grammatical structure. Practise complete subject–verb sentences and check articles, punctuation, and clause connections; simpler, accurate comparisons will improve clarity.
See this exact question answered at other band scores. The same prompt compared across bands.
Browse more IELTS Writing model answers or get your own writing scored by the same AI examiner.