Band 4.5 IELTS Writing Task 1 Model Answer
Overall Band Score: 4.5 · Cambridge IELTS 13 · 2026-11-09
IELTS Writing Task 1 question
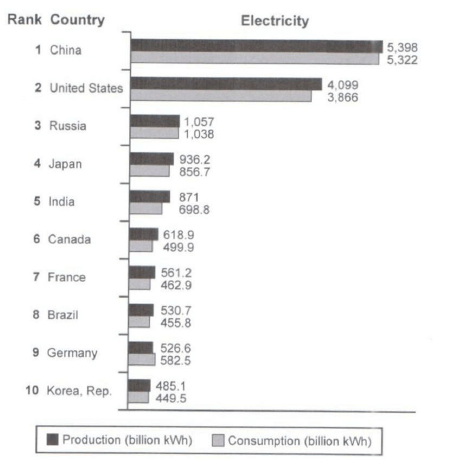
The bar chart below shows the top ten countries for the production and consumption of electricity in 2014.
Summarize the information by selecting and reporting the main features, and make comparisons where relevant.
Student answer (Band 4.5)
The electricity is most impotant role impact in human lives and technology sectors.I explaining the information in details for electricity consumption since 2014.
first rank is China is production 5398 and consumption is 5322 is highist rank in world. Secondly, The United States is production is 4099 and consumption is less then production as say 3866. Thirdly Russia production is low the China and United States is number as 1057kw production is provide to the country is Russia electricity is consume approximately 1038. Number four is Japan is production 936.2kw is low production then Russia is consumption 856.7. Number five is india this is very big country compare to other country is production as 871 and consumption is 698.8. Number six Canada is production rates is 618.9 kw and consumption is 499.9 is less compare to other countries. Number Seven is france is production is561.2 and consumption is 462.9 and number 8 is Brazil is production is 530.7 and consumption is 455.8 is less than compare to other countries and number 9 is Germany is production 526.6 and consumption is 582.5 and last number is Korea Republic is production below to to other all counties is 485.1 and consumption is also below to other is 449.5.
Eleclricity is important rule in country while people serve this source of energy. Some is important is improve the production.
AI examiner evaluation
| Criterion | Band |
|---|---|
| Task Achievement / Task Response | 4.5 |
| Coherence and Cohesion | 5.0 |
| Lexical Resource | 4.5 |
| Grammatical Range and Accuracy | 4.5 |
| Overall | 4.5 |
Task Achievement / Task Response: Band 4.5
You report figures for all ten countries, and most of the values you give match the chart, including China’s leading production and consumption and Germany’s higher consumption than production. However, the response mainly lists countries in rank order rather than selecting and summarising the main features. There is no clear overview of the large gap between China and the United States and the remaining countries, or of the general pattern that production exceeds consumption in most cases. The opening and closing comments about electricity’s importance do not answer the chart task, and some comparisons, such as calling Canada’s figures “less compare to other countries,” are unclear. A concise overview followed by grouped comparisons would make the response more complete and focused.
Coherence and Cohesion: Band 5.0
The country-by-country sequence gives the reader a basic route through the data, and ordinal markers such as “first,” “Secondly,” and “Number five” help identify each entry. However, the response has little overall progression beyond this repeated list: it does not separate an overview from supporting details or group countries by meaningful similarities. Many sentences run together, and links such as “and,” “is,” and “less” are repeated or used inaccurately, making relationships between figures difficult to follow. The final general comments also feel disconnected from the chart description. Use clear paragraphs for the overview and comparisons, and connect figures with precise contrast language such as “whereas” or “by comparison.”
Lexical Resource: Band 4.5
The response uses some relevant chart vocabulary, including “production,” “consumption,” “rank,” and “approximately,” so the topic is generally recognisable. However, the range is basic and repetitive, and several word choices or collocations make the meaning awkward: “highist rank,” “production is provide,” and “less compare to other countries.” There are also spelling errors such as “impotant,” “Eleclricity,” and “counties,” which reduce accuracy. Aim for standard data-reporting phrases and avoid describing every figure with the same wording. For example, you could say that China “recorded the highest figures” and that consumption “was lower than production” in most countries.
Grammatical Range and Accuracy: Band 4.5
Most of the response relies on short, simple statements, with limited control of more varied sentence structures. Frequent errors in sentence formation and verb patterns make several passages difficult to interpret, as in “I explaining the information in details” and “production is provide to the country is Russia.” Articles, agreement, and punctuation are also inconsistent; for example, “The United States is production is 4099” contains an unclear structure, while long sequences joined by “and” lack clear sentence boundaries. The figures themselves are often understandable, but the grammar regularly obscures the comparisons. Practise accurate patterns such as “China produced X, while it consumed Y,” and use full stops to separate each comparison.
See this exact question answered at other band scores. The same prompt compared across bands.
Browse more IELTS Writing model answers or get your own writing scored by the same AI examiner.