Band 6.5 IELTS Writing Task 1 Model Answer
Overall Band Score: 6.5 · Cambridge IELTS 13 · 2026-11-09
IELTS Writing Task 1 question
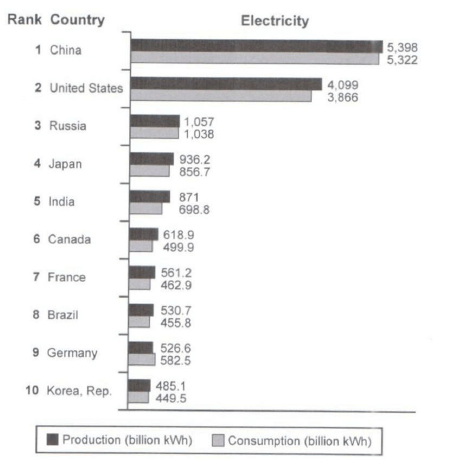
The bar chart below shows the top ten countries for the production and consumption of electricity in 2014.
Summarize the information by selecting and reporting the main features, and make comparisons where relevant.
Student answer (Band 6.5)
The bar chart illustrates the top ten states which produced and consumed electrical power in 2014. The units are given in billion kWh.
Overall, the production and consumption of electricity remained significantly higher in china throughout the year. In contrast both production and consumption in Korea republic stayed low during the period. Notably, Russia recorded almost similar figures in production and usage of electricity.
To begin with, China was on the top of the list having recorded 5,398 billion kWh and 5,322 billion kWh in production and usage respectively. Similarly, United States was the second on the catalogue with production being slightly higher than consumption accounting for 4,099 billion kWh and 3,866 billion kWh, respectively. Moreover, Russia was third in rank having slightly similar numbers in production and consumption with 1,057 and 1,038 billion kWh in that order.
Regarding, Japan and India producing electricity was higher than usage. For the other nations the figures decreased as we moved down the list with the Korea republic coming last
AI examiner evaluation
| Criterion | Band |
|---|---|
| Task Achievement / Task Response | 6.0 |
| Coherence and Cohesion | 6.5 |
| Lexical Resource | 6.5 |
| Grammatical Range and Accuracy | 6.5 |
| Overall | 6.5 |
Task Achievement / Task Response: Band 6.0
You identify the chart’s subject and give a clear overview: China leads both measures, Korea is at the bottom, and Russia’s production and consumption are close. The figures for China, the United States and Russia are accurate, and you note that Japan and India produce more than they consume. However, the report becomes incomplete after this point. The final paragraph says figures “decreased as we moved down the list,” which overlooks Germany, where consumption (582.5) exceeds production (526.6), and does not report the remaining countries’ comparisons or values. Also, “throughout the year” suggests a time trend, although the chart compares countries in 2014. Covering the lower-ranked countries more fully and describing the comparison precisely would strengthen the response.
Coherence and Cohesion: Band 6.5
The response has a recognisable structure, moving from an introduction and overview to details, and the sequence from China to the United States and Russia follows the chart’s ranking. Linking expressions such as “Overall,” “Similarly” and “Moreover” help signal relationships between points. This gives the report a coherent overall arrangement. However, the final paragraph is very brief and ends without a complete summary of the remaining data, so the progression feels unfinished. “Regarding” is also used awkwardly to introduce Japan and India, and “For the other nations” does not clearly connect the general claim to the specific comparisons. Grouping the remaining countries and using clearer transitions would make the cohesion more flexible and the ending more complete.
Lexical Resource: Band 6.5
You use a suitable range of chart-reporting vocabulary, including “illustrates,” “recorded,” “production,” “consumption” and “respectively.” These choices make the main comparisons understandable, and terms such as “significantly higher” and “slightly similar” show an attempt to describe differences precisely. Some word choices are less natural or not quite accurate for this chart: “states” is not the best label for countries, “catalogue” is an awkward substitute for ranking, and “usage of electricity” is less precise than “consumption.” “Slightly similar” is also unclear because the figures are close rather than similar by degree. More conventional collocations for describing rankings and comparing figures would improve precision and control.
Grammatical Range and Accuracy: Band 6.5
You use a mix of simple and more complex sentence forms, including the opening clause “having recorded…” and the comparison structure “with production being slightly higher than consumption.” Most sentences communicate their meaning clearly, and the figures are generally integrated into grammatical sentences. Some errors and awkward constructions remain. In “Regarding, Japan and India producing electricity was higher than usage,” the introductory word is punctuated incorrectly and the sentence structure is difficult to follow; a direct construction such as “In Japan and India, production was higher than consumption” would be clearer. The final sentence lacks closing punctuation, and “In contrast both…” needs a comma after the introductory phrase. More consistent control of these patterns would make the writing smoother.
See this exact question answered at other band scores. The same prompt compared across bands.
Browse more IELTS Writing model answers or get your own writing scored by the same AI examiner.