Band 5.5 IELTS Writing Task 1 Model Answer
Overall Band Score: 5.5 · Cambridge IELTS 13 · 2026-11-09
IELTS Writing Task 1 question
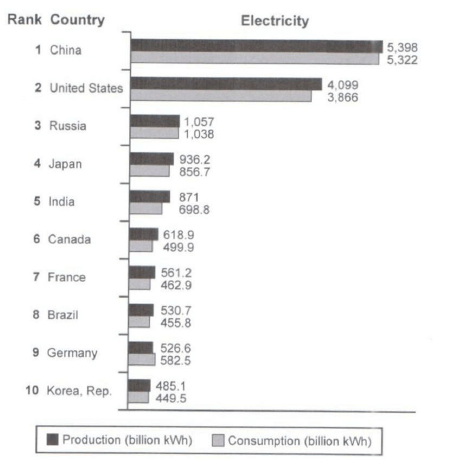
The bar chart below shows the top ten countries for the production and consumption of electricity in 2014.
Summarize the information by selecting and reporting the main features, and make comparisons where relevant.
Student answer (Band 5.5)
The bar chart illustrates how much top ten countries produced and used the electricity in billion kWh in 2014.
The production of electricity declined from top to bottom. China showed maximum production and consumption of electricity among all other countries. Whereas, Korea, Rep. manufactured minimal amount and also people used less electricity.
The chart depicts that China produced 5,398 billion kWh of electricity while their consumption rate is minimized as compare to their manufacturing rate that is 5,322. In United States, electricity made about 4,099 billion kWh whereas, people used 3,866 billion kWh electricity. Russia was declined in both departments as compare to above two countries. Moreever, Japan also followed same trend as it decreased further. It produced nearly 940 billion kWh and used probably 960. In India, production and consumption rate fell down in comparison with all above countries.
In next five countires, same trend followed as in Canada, electricity manufactured at the rate of 618,9 billion kWh while people used almost 500 billion kWh. France also showed declined in both departments. In Brazil, production rate fell down and reached up to 530,7 billion kWh while people consumed 455,8 billion kWh. In Germany, production rate followed same declined trend. However, consumption rate is maximized and reached up to 582,5. While Korea, Rep again deminised in both sections. It is declined among all other countries in both sections.
AI examiner evaluation
| Criterion | Band |
|---|---|
| Task Achievement / Task Response | 5.0 |
| Coherence and Cohesion | 5.5 |
| Lexical Resource | 5.5 |
| Grammatical Range and Accuracy | 5.0 |
| Overall | 5.5 |
Task Achievement / Task Response: Band 5.0
You identify the chart’s subject and report several relevant comparisons, including China and the United States as the largest producers and consumers, and Germany’s unusually high consumption relative to its production. However, the overview is incomplete: saying production “declined from top to bottom” misses the broad gap between the first two countries and the remaining countries, and the claim that Korea had the lowest consumption is inaccurate because Germany’s figure is higher than its production but Korea is still the lowest consumer. There are also important data errors: Japan’s consumption was about 857 billion kWh, not 960, and India’s figures are not reported. To strengthen the response, give a clearer overview and check each comparison against the chart.
Coherence and Cohesion: Band 5.5
The response has a recognisable structure, moving from an introduction and overview to details about the countries, and paragraphing helps separate the information. Some comparisons are also linked with words such as “whereas,” “however” and “while.” However, the progression is not consistently clear: the account moves through countries in groups without a fully controlled comparison, and “Russia was declined in both departments” and “Japan also followed same trend” leave the intended relationship vague. Several linking expressions are repetitive or awkward, particularly repeated uses of “declined” and “same trend.” Organise the details into clearer groups—for example, the two leading countries and the much lower figures for the others—and use references that make each comparison explicit.
Lexical Resource: Band 5.5
You use relevant topic vocabulary, including “production,” “consumption,” “manufactured” and “consumed,” and the reader can generally understand the intended comparisons. However, the range is limited by repeated wording such as “declined,” “rate” and “same trend,” while several choices are inaccurate or unnatural: “consumption rate is minimized,” “production rate fell down,” and “deminised” do not express the data naturally. There are also spelling errors, including “Moreever” and “countires,” and number formatting such as “618,9” is unsuitable in English. Use precise chart language such as “stood at,” “was slightly lower,” and “recorded,” and check spelling and decimal-point conventions.
Grammatical Range and Accuracy: Band 5.0
The response attempts some complex sentences, especially comparisons using “while” and “whereas,” and most of the main ideas remain understandable. However, errors are frequent, and complex constructions are often faulty. For example, “Russia was declined” uses an incorrect passive form, while “China showed maximum production” and “In United States” have article problems. Tense and agreement are also inconsistent: “consumption rate is maximized” shifts to the present, and “It is declined” is not a correct past-tense construction. Some sentences are joined or punctuated awkwardly, as in “Whereas, Korea…” and “While Korea…”. Practise accurate past-tense reporting and build comparisons with complete, correctly punctuated clauses.
See this exact question answered at other band scores. The same prompt compared across bands.
Browse more IELTS Writing model answers or get your own writing scored by the same AI examiner.