Band 5.0 IELTS Writing Task 1 Model Answer
Overall Band Score: 5.0 · Cambridge IELTS 13 · 2026-11-13
IELTS Writing Task 1 question
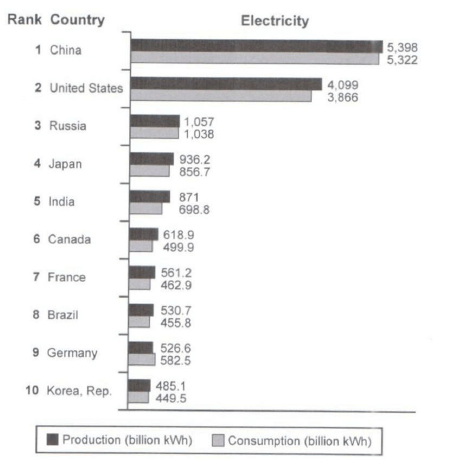
The bar chart below shows the top ten countries for the production and consumption of electricity in 2014.
Summarize the information by selecting and reporting the main features, and make comparisons where relevant.
Student answer (Band 5.0)
The given bar chart compares the productivity and electricity consumption in terms of billion kwh of top 10 countries in 2014.
Overall, China ranked first while Koria secured 10th rank in terms of electricity production and consumption as well.
It is depicted from the figure that the electricity generation of China is 5398 billion KWH and the electrical consumption is 5322 billion KWH. On the otherhand the electricity production of United States is 4099 billion KWH, Russia is 1057 billion KWH, Japan is 936.2 billion KWH, India is 871billion KWH, Canada is 618.9 billion KWH, France is 561.2 billion KWH, Brazil is 530.7 billion KWH, Germany is 526.6 billion KWH, Koria, Rep is 485.1 billion KWH respectively Whereas the electrical consumption of United States is 3866 billion KWH, Russia is 1038 billion KWH, Japan is 856.7billion KWH, India is 698.8billion KWH, Canada is 499.9 billion KWH, France is462.9 billion KWH, Brazil is 455.8 billion KWH, Germany is 582.5 billion KWH, Koria, Rep is 449.5 billion KWH subsequently.
AI examiner evaluation
| Criterion | Band |
|---|---|
| Task Achievement / Task Response | 4.5 |
| Coherence and Cohesion | 5.5 |
| Lexical Resource | 5.5 |
| Grammatical Range and Accuracy | 5.0 |
| Overall | 5.0 |
Task Achievement / Task Response: Band 4.5
The response identifies the chart’s subject and gives a relevant overview by noting that China ranks first and Korea tenth in both measures. It also reports the production and consumption figures for all ten countries accurately, including Germany’s higher consumption than production. However, the response is largely a list of figures: it does not draw out key comparisons, such as the large gap between China and the United States and the much lower values for the remaining countries, or the fact that production exceeds consumption in nearly every country. The overview is therefore limited, and the main features are not sufficiently selected or summarised. To strengthen the response, group figures into meaningful comparisons and highlight the notable exception of Germany.
Coherence and Cohesion: Band 5.5
The response has a basic overall structure: an introduction, a brief overview, and a detailed account of production followed by consumption. This makes the information broadly understandable, and the sequence within each list follows the chart’s ranking. However, most of the body is packed into one very long sentence, so the reader has to work through many figures without clear breaks or comparison. Linking expressions such as “On the other hand” and “respectively” do not establish a clear contrast or relationship in this context, and “Whereas” is awkwardly attached to the preceding list. Use separate paragraphs or shorter sentences, and organise the data into groups so that comparisons guide the reader through the information.
Lexical Resource: Band 5.5
The response uses enough task-related vocabulary to communicate the chart’s subject, including “production,” “consumption,” “ranked first,” and “electricity generation.” There is some variation in how the two measures are described. However, word choice and spelling are often inaccurate or unnatural: “productivity” is not the right term for electricity output, “Koria” is misspelled, and “secured 10th rank” is an awkward collocation. “Electrical consumption” is also less natural than “electricity consumption.” Repetition of “billion KWH” throughout makes the account cumbersome. Aim for accurate, conventional chart language and use concise references to the units after establishing them, while checking country names and spelling.
Grammatical Range and Accuracy: Band 5.0
The response attempts both simple statements and longer structures, and the opening sentence and overview are generally understandable. However, the range is limited, with most of the report relying on lists joined into a single extended sentence. This creates problems with sentence boundaries and punctuation, particularly where “respectively Whereas” begins the consumption section without a full stop. There are also errors in grammatical forms and spacing, such as “871billion” and “is462.9,” and inconsistent capitalisation of units. The long list structure makes relationships between figures difficult to follow. Use shorter, complete sentences with clear punctuation, and practise combining comparisons through controlled clauses rather than joining many figures together.
See this exact question answered at other band scores. The same prompt compared across bands.
Browse more IELTS Writing model answers or get your own writing scored by the same AI examiner.