Band 5.5 IELTS Writing Task 1 Model Answer
Overall Band Score: 5.5 · Cambridge IELTS 13 · 2026-11-13
IELTS Writing Task 1 question
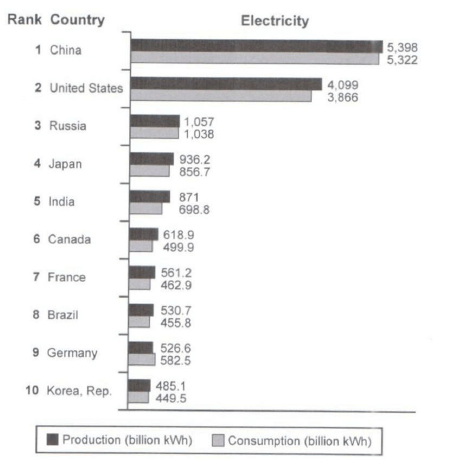
The bar chart below shows the top ten countries for the production and consumption of electricity in 2014.
Summarize the information by selecting and reporting the main features, and make comparisons where relevant.
Student answer (Band 5.5)
The bar chart illustrates the top ten countries for the production and consumption of electricity in 2014, measured in billion KWh.
Overall, China accounted for the largest proportion of electricity consumption and production, whereas Republic of Korea represented the lowest share in electricity consumption as well as production in 2014. In contrast, United states had a significant large part and the rest took part in small proportions of electricty usage and production.
Turning to the bar chart, China showed a significant role in electricity productionc and consumption by holding the largest parts, at 5,398 and 5,322. United states followed China by accounting for 4,099 production and 5,322 consumption, sharing a substantial proportion in energy production and usage. In comparison, Russia only produced 1,057 electricity and consumed approximately same proporption at 1,039. Similarly, Japan produced 9,36.2 which was sufficient as compared to the consumption at just 856.7. India presented as the low energy producing country by producing only 871 and using 698.8. In addition, Canada accounted for a significantly short production, at just 618.9 and consumption, at 499.9 less than the production. France, Brazil, Germany showed roughly same production, at 561.2, 530.7, and 526.6, respectively. However, Germaney's consumption exceeded its production, at 582.5. Korea had the lowest
AI examiner evaluation
| Criterion | Band |
|---|---|
| Task Achievement / Task Response | 5.5 |
| Coherence and Cohesion | 5.5 |
| Lexical Resource | 5.5 |
| Grammatical Range and Accuracy | 5.5 |
| Overall | 5.5 |
Task Achievement / Task Response: Band 5.5
You identify the chart’s subject and give a clear overview of the leading and lowest countries, which addresses the main features. Several figures are reported accurately, including China’s production and consumption and the values for Russia, Japan and India. However, a key comparison is incorrect: the United States consumed 3,866 billion kWh, not 5,322; that figure belongs to China. The overview also says Korea had the lowest consumption, but Germany’s consumption (582.5) was higher than its production and Korea’s was 449.5, so Korea was not the lowest consumer. The final sentence is cut off, leaving Korea’s data incomplete. To strengthen the response, check each figure against the chart and complete the comparison of production and consumption across the countries.
Coherence and Cohesion: Band 5.5
The response has a recognisable structure: an introduction, an overview and a paragraph of country-by-country details. Sequencing from China and the United States to the other countries is generally understandable, and transitions such as “Overall,” “In contrast” and “Similarly” help signal relationships. However, progression becomes list-like, with several countries grouped without a clear comparison, and some linking language does not accurately express the relationship—for example, “In contrast” introduces a point that does not clearly contrast with the preceding overview. The final phrase, “Korea had the lowest,” is unfinished and disrupts the ending. Organise the details into clearer groups, such as the two leading countries and the remaining countries, and use linking expressions only when their logical relationship is clear.
Lexical Resource: Band 5.5
You use relevant chart vocabulary, including “production,” “consumption,” “accounted for,” and “exceeded,” and the reader can generally understand the comparisons you intend. However, the range is limited by repeated, imprecise phrases such as “significant role,” “largest parts” and “small proportions,” which do not describe the figures naturally. There are also noticeable spelling errors, including “electricty,” “proporption” and “Germaney,” as well as inconsistent capitalisation of “United States.” Some collocations are awkward: “a significantly short production” is not idiomatic, and “produced 9,36.2” uses an incorrect number format. Aim for precise chart language such as “generated,” “recorded,” “stood at” and “slightly lower,” and proofread spelling and numerical presentation.
Grammatical Range and Accuracy: Band 5.5
You attempt a mixture of simple and complex sentences, including clauses introduced by “whereas,” “by” and “as compared to,” and most of the intended meaning remains understandable. However, errors recur in sentence construction and grammatical patterns. For example, “United states followed China by accounting for 4,099 production and 5,322 consumption” lacks clear parallel structure, while “India presented as the low energy producing country” is missing a suitable verb construction. The sentence beginning “France, Brazil, Germany showed…” also needs clearer punctuation and structure, and the final sentence is incomplete. Use consistent patterns such as “produced X and consumed Y,” check articles and verb forms, and ensure every sentence is complete. These improvements would make the comparisons easier to follow.
See this exact question answered at other band scores. The same prompt compared across bands.
Browse more IELTS Writing model answers or get your own writing scored by the same AI examiner.