Band 5.5 IELTS Writing Task 1 Model Answer
Overall Band Score: 5.5 · Cambridge IELTS 13 · 2026-11-14
IELTS Writing Task 1 question
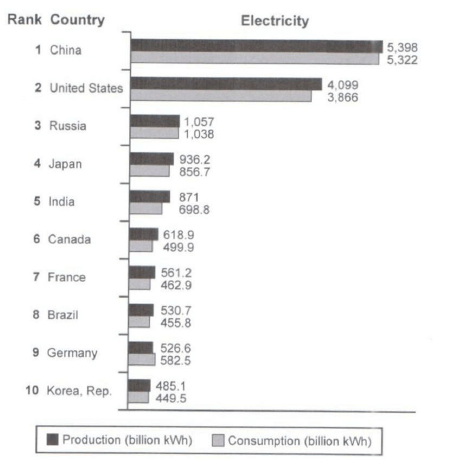
The bar chart below shows the top ten countries for the production and consumption of electricity in 2014.
Summarize the information by selecting and reporting the main features, and make comparisons where relevant.
Student answer (Band 5.5)
The bar chart illustrates the top ten countries (China, United States, Russia, Japan, India, Canada, France, Brazil, Germany, Korea) for the production and consumption of electricity in 2014.
Overall, it is clear that China showed the highest number, while Korea the lowest one. Moreover, the production figuers were more than the consumption in the majority of countries.
starting with the highest one, China presented over 5.300 billion kWh in production and consumption, in the United States the figure of production was 4.099 billion kWh more than the consumption that was 3.866 billion kWh. In addition, in Russia both figuers were close (production and consumption) with 1.057 and 1.038 recpectively. Furthermore, in Jepan the figure show 936.2 in production and 856.7 in consumption.
Moving to India the production stood at 871 billion kWh and consumption was 689.8 billion kWh. Additionally, the figure in canada illustrates 618.9 billion kWh in production and 499.9 billion kWh. The amount of production was almost equal with an average of approximately 540 billion kWh in France, Brazil and Germany, while the consumption was different :462.9 billion kWh in France, 455.8 in Brazil and 582.5 in Germany. Looking at the lowest figure, Korea registred 485.1 billion kWh in production and 449.5 in consumption.
AI examiner evaluation
| Criterion | Band |
|---|---|
| Task Achievement / Task Response | 5.5 |
| Coherence and Cohesion | 5.5 |
| Lexical Resource | 5.5 |
| Grammatical Range and Accuracy | 5.5 |
| Overall | 5.5 |
Task Achievement / Task Response: Band 5.5
You identify the chart’s subject and give a relevant overview: China has the highest figures, Korea the lowest, and production exceeds consumption in most countries. You also select data from across the ranking and make useful comparisons, such as the close figures for Russia and the higher German consumption. However, some details are inaccurate: India’s consumption is 698.8, not 689.8 billion kWh, and the overview’s claim that Korea has the lowest figure is not fully precise because Germany’s production is higher than Korea’s, but Korea has the lowest consumption. The comparison of France, Brazil and Germany is also broad and could be clearer. More accurate reporting and a sharper overview of the main contrasts would strengthen the response.
Coherence and Cohesion: Band 5.5
The response has a recognisable structure, moving from an introduction and overview to groups of country figures, and paragraphing helps separate the main points. Sequencing phrases such as “starting with” and “Moving to India” guide the reader through the data. However, progression is somewhat mechanical, with many details linked by “In addition” and “Furthermore,” and the final paragraph combines several countries without a consistently clear comparison. Some references are also vague, as in “the figure” and “the amount of production,” so readers must infer which country or measure is meant. Grouping countries by scale or by notable differences, and using clearer comparisons between production and consumption, would make the organisation more effective.
Lexical Resource: Band 5.5
You use relevant chart vocabulary, including “production,” “consumption,” “stood at,” “highest,” and “lowest,” and the meaning is generally understandable. There is some variation in how figures are introduced, but several word-choice and spelling problems reduce precision: “figuers,” “recpectively,” “Jepan,” “registred,” and “presented” in “China presented over 5.300” are noticeable. “Showed the highest number” is also less natural for describing values, while “the figure show” is an imprecise collocation. Aim for accurate spelling and standard reporting phrases such as “recorded,” “amounted to,” and “respectively.” This would make the vocabulary more controlled and appropriate to an academic data summary.
Grammatical Range and Accuracy: Band 5.5
You attempt a mixture of simple and longer sentences, including comparisons joined with “while” and clauses introduced by “that.” Most figures and relationships remain understandable. However, control is uneven in longer constructions: “in the United States the figure of production was … more than the consumption that was …” is awkwardly structured, and “the figure show 936.2” has a subject–verb agreement error. The overview also begins a new sentence with lowercase “starting,” and punctuation around the colon in the final comparison is not well controlled. Some sentences rely on repeated basic patterns rather than showing a consistently accurate range. Practise concise comparative structures, for example, “US production was 4,099 billion kWh, compared with consumption of 3,866 billion kWh.”
See this exact question answered at other band scores. The same prompt compared across bands.
Browse more IELTS Writing model answers or get your own writing scored by the same AI examiner.