Band 5.5 IELTS Writing Task 1 Model Answer
Overall Band Score: 5.5 · Cambridge IELTS 13 · 2026-11-15
IELTS Writing Task 1 question
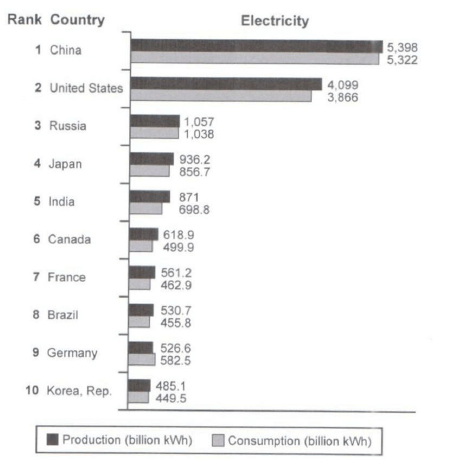
The bar chart below shows the top ten countries for the production and consumption of electricity in 2014.
Summarize the information by selecting and reporting the main features, and make comparisons where relevant.
Student answer (Band 5.5)
The Given bar chart illustrates the information about production and consumption of electricity in year 2014 by top ten countries. production and consumption is calculated in billion kWh here.
First country with highest consumption and production is China, it states 5,398 kWh production and 5,322 kWh consumption. It is highest amongst all ten listed countries in the bar chart. The second country is United states, it comes in 2nd number in terms of highest electricity production and consumption which is 4099 and 3866 respectively.
From the 3rd country rest all other countries has very less number of production and consumption of electricity, if we look at russia which is at number3rd in the bar chart it has 1057 prodction and 1038 consumption which is very less if we compare to China and United states. The other country is japan it has also very close number of production and consiumption if we compare to russia.
The other countries namely India, Canada, France, Brazil, Germany and korea has very close or similar number of production and consumption of electricity which ranges from 936.2 and lowest is 449.5. Overall the korea is the country with lowest number of production and consumption which is 485.1 and 449.5 respectively.
Hence highest number of production and consumption title goes to China and lowest number of production and consumption goes to Korea.
AI examiner evaluation
| Criterion | Band |
|---|---|
| Task Achievement / Task Response | 5.5 |
| Coherence and Cohesion | 6.0 |
| Lexical Resource | 5.0 |
| Grammatical Range and Accuracy | 5.0 |
| Overall | 5.5 |
Task Achievement / Task Response: Band 5.5
You identify the main extremes accurately: China leads both production and consumption, while Korea has the lowest figures, and you include several relevant values for China, the United States and Russia. However, the overview is limited and some comparisons are unclear or inaccurate. The claim that the other countries have “very close or similar” figures overlooks the substantial differences between Japan and the lower-producing countries; the stated range also mixes production and consumption values without explaining it. Germany is an important exception because its consumption (582.5) exceeds its production (526.6), but this is not reported. To strengthen the response, give a clearer overview of the large gap between the top two countries and the rest, and select a few accurate comparisons across the remaining countries.
Coherence and Cohesion: Band 6.0
The response has a generally understandable sequence: it introduces the chart, discusses the leading countries, moves to the remaining group, and ends by restating the extremes. Paragraphing helps separate these stages, and phrases such as “The second country” and “Overall” guide the reader. However, progression is sometimes mechanical, with repeated “The other country/countries” constructions, and the final “Hence” sentence repeats the conclusion rather than adding a useful comparison. Some references are imprecise, as in “From the 3rd country rest all other countries,” which makes the relationship between the groups difficult to follow. Organise the body around clear comparisons—top two, middle group, and exceptions—and use linking and referencing more naturally.
Lexical Resource: Band 5.0
You use relevant chart vocabulary, including “production,” “consumption,” “highest,” “lowest,” and “respectively,” so the topic remains clear. However, the range is limited and several phrases are repetitive or imprecise, such as “number of production and consumption” and “title goes to China.” Some word forms and spellings also reduce accuracy, including “prodction,” “consiumption,” and “korea.” Use more precise terms for quantities and comparisons, such as “output,” “electricity use,” “figure,” and “exceeded.” Avoid repeating “country” and “number” where a specific comparison can be made. More accurate spelling and natural collocations would make the report clearer and more appropriate for an academic summary.
Grammatical Range and Accuracy: Band 5.0
The response communicates its main points through mostly simple sentences, with some attempts at longer structures, such as “if we compare to China and United states.” However, grammatical control is uneven. Examples include “production and consumption is calculated,” where the plural subject requires a plural verb, and “rest all other countries has,” which has faulty agreement and sentence construction. Articles and sentence boundaries are also inconsistent, as in “in year 2014” and the run-on structure beginning “From the 3rd country.” Capitalisation and punctuation are not consistently controlled. Practise accurate subject–verb agreement, articles, and complete sentence structures first; then add a few well-controlled complex comparisons rather than joining ideas loosely.
See this exact question answered at other band scores. The same prompt compared across bands.
Browse more IELTS Writing model answers or get your own writing scored by the same AI examiner.