Band 5.0 IELTS Writing Task 1 Model Answer
Overall Band Score: 5.0 · Cambridge IELTS 13 · 2026-11-16
IELTS Writing Task 1 question
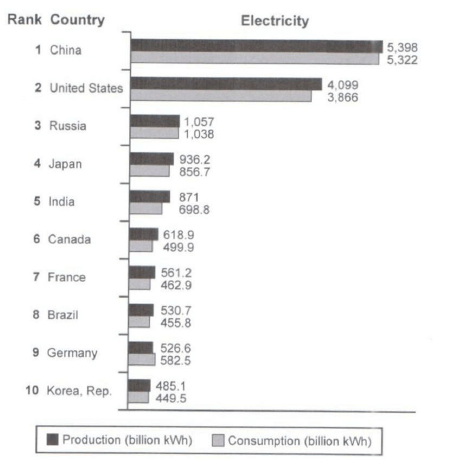
The bar chart below shows the top ten countries for the production and consumption of electricity in 2014.
Summarize the information by selecting and reporting the main features, and make comparisons where relevant.
Student answer (Band 5.0)
The bar chart illustrates that the top ten countries which has the production and consumption of electricity in the year 2014.Overall the use of electricity has become more nowadays. People are using electricity in day to day life in all the ways in the same way there are multiple adavantages of using electricity.
In 2014 the use and production of electricity by korea is very less and ranks as top 10 among the users where it has a production of 485.1 billion kwh, while its has a consumption of 449.5 billion kwh where the production is more and consumption is less.In germany the production of electricity was 526.6 billion kwh and consumption was 582.5 billion kwh as it ranks top 9 among the users while production is less and consumption is high.In Brazil the production of electricity is 530.7 billion kwh which is more and consumption is 455.8 billion kwh which is less compared to production and it also ranks as top 8 among the users.The country france ranks as top 7 among the user which as production of 561.2 billion kwh and consumption of 462.9 billion kwh.In canada the production of electricity has 618.9 billion kwh and consumption of 499.9 billion kwh where it ranks top 6 among the users.
In a similar way in India the production of electricity is 871 billion kwh and consumption of 698.8 billion kwh as it ranks top 5 among the users. In a country japan it ranks as top 4 among the users where it produces 936.2 billion kwh and consumes 856.7 billion kwh of electricity.In russia the production is 1057 billion kwh , consumes 1038 billion kwh and it ranks top 3 among the users. The united states ranks top 2 among the users and produces 4099 billion kwh and consumes 3866 billion kwh of electricity. Lastly China it stands number 1 country to produce 5398 billion kwh and consumes 5322 billion kwh of electricty and it has highest production and consumption rate in the world
AI examiner evaluation
| Criterion | Band |
|---|---|
| Task Achievement / Task Response | 5.0 |
| Coherence and Cohesion | 5.5 |
| Lexical Resource | 5.0 |
| Grammatical Range and Accuracy | 5.0 |
| Overall | 5.0 |
Task Achievement / Task Response: Band 5.0
You report figures for all ten countries, and most are accurate; for example, China’s production and consumption are given as 5,398 and 5,322 billion kWh. However, the response only partly fulfils the task because it lacks a clear, data-based overview. The opening claim that electricity use “has become more nowadays” is not supported by a chart showing only one year, and the comments about everyday use and its advantages are irrelevant. You do identify China and the United States as the largest producers and consumers, but do not clearly summarise the overall pattern that production exceeds consumption in nearly every country, with Germany the exception. Focus on the chart’s main comparisons rather than general commentary.
Coherence and Cohesion: Band 5.5
The response has some organisation: it moves through the countries in rank order and separates the lower-ranked group from the higher-ranked group with a paragraph break. This gives the reader a basic route through the data. However, progression is largely a repeated list of individual figures rather than a synthesis of related information. Phrases such as “In a similar way” and “Lastly” provide limited links, while repeated wording such as “ranks top … among the users” makes the account mechanical. The opening general comments also interrupt the chart description. Grouping countries by scale or by whether production exceeds consumption, and using clearer paragraph purposes, would make the progression easier to follow.
Lexical Resource: Band 5.0
Your vocabulary is sufficient to identify the chart’s subject and report its data, using terms such as “production,” “consumption,” and “billion kwh.” However, the range is limited and several expressions are repetitive or imprecise, including “ranks top … among the users” and “use of electricity.” Some word choices do not suit a formal chart summary: “advantages” and “day to day life” introduce ideas not shown in the visual. There are also spelling and form errors, such as “adavantages” and “electricty,” and inconsistent capitalisation of country names and the unit. Use concise chart language such as “ranked,” “generated,” and “consumed,” and check spelling and standard unit formatting.
Grammatical Range and Accuracy: Band 5.0
You attempt both simple statements and longer clauses, but the range is limited and errors recur, sometimes making relationships between ideas harder to follow. For example, “the top ten countries which has” has a subject–verb agreement error, while “where it has a production” and “where it ranks” use unclear clause structures. Several sentences run together without appropriate full stops, as in the opening and the long final sentence about China. Tense and sentence patterns also shift between “was,” “is,” and “produces” when describing the same 2014 data. Practise accurate simple comparisons first, then combine them with controlled clauses; use consistent past tense and punctuate each country comparison clearly.
See this exact question answered at other band scores. The same prompt compared across bands.
Browse more IELTS Writing model answers or get your own writing scored by the same AI examiner.