Band 4.5 IELTS Writing Task 1 Model Answer
Overall Band Score: 4.5 · Cambridge IELTS 13 · 2026-11-16
IELTS Writing Task 1 question
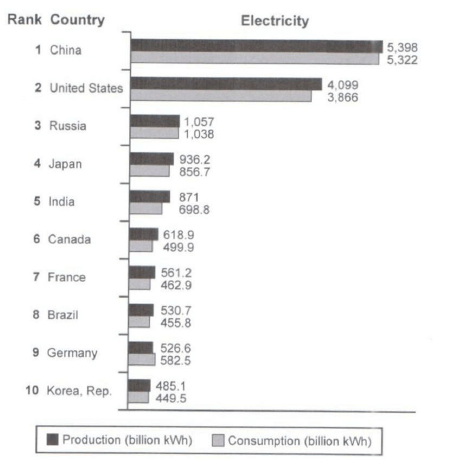
The bar chart below shows the top ten countries for the production and consumption of electricity in 2014.
Summarize the information by selecting and reporting the main features, and make comparisons where relevant.
Student answer (Band 4.5)
In this report has one bar chart this chart show that the top ten countries how much production and consumption of electricity in 2014.In this chart including country Chine, US, Russia, Japan, India, Canada, France, Brazil, Germany and Korea.Production means billion kWh and Consumption mean billion kWh.
Firstly,I describe the some cities which spend high electricity. China describe high electicity in this graph.So, Chine use production 5,398(kWh) and Consumption use 5,322(kWh). And second country is United States so US use Production 4,099(kWh) and Consumption use 3,866(kWh).Russia use Production 1,057(kWh) and Consumption use 1,038.And Japan Production use 936.2 and Consumption use 856.7
Secondly, Now i describe some cities which consume low electricity. In this include city India so india use Production 871 and Concuption use 689.8.After that Canada spend 618.9 on production and 499.9 consume on Consumption.So now i describe at least use Consumption and Production. So this countrty is Korea in Korea use Pro 485.1 and spend Con 449.5.
AI examiner evaluation
| Criterion | Band |
|---|---|
| Task Achievement / Task Response | 4.5 |
| Coherence and Cohesion | 5.0 |
| Lexical Resource | 4.5 |
| Grammatical Range and Accuracy | 4.5 |
| Overall | 4.5 |
Task Achievement / Task Response: Band 4.5
You identify the chart’s subject and report several figures accurately, including China, the United States, Russia and Japan. However, the response mainly lists selected countries rather than summarising the main features of the data. It gives no clear overview of the dominant pattern—that China and the US are far ahead of the other countries—and omits several countries, including France, Brazil and Germany. There is also a factual error: India’s consumption is 698.8 billion kWh, not 689.8. The statement that you will describe countries with “low electricity” is not supported by a clear comparison. To strengthen the report, give an overview first, compare the largest and smallest figures, and accurately select representative data.
Coherence and Cohesion: Band 5.0
The response has a basic structure, with an introductory paragraph followed by sections beginning “Firstly” and “Secondly.” These markers help the reader recognise a sequence, and the figures are generally grouped by country. However, the progression is repetitive and does not build a clear comparison: the second paragraph moves from India and Canada to “at least use” without explaining how these countries relate to one another. Repeated phrases such as “So now I describe” also interrupt the flow, while the introduction and body are not clearly separated by a focused overview. Organise the report into an introduction, a concise overview, and comparison-based detail paragraphs; use linking expressions to show contrasts or rankings rather than simply announcing the next point.
Lexical Resource: Band 4.5
Your vocabulary is basic and repetitive, with frequent reliance on “use,” “describe,” “spend” and “electricity.” Some choices make the intended meaning unclear: “cities” refers to countries, and “China describe high electicity” does not express the comparison naturally. There are also spelling errors, including “Chine,” “electicity,” “Concuption” and “countrty,” which reduce accuracy. You do use relevant chart terms such as “production,” “consumption” and “billion kWh,” so the topic is recognisable. Build a more precise range of reporting language, for example “generated,” “consumed,” “recorded” and “stood at,” and check spelling and collocations before finishing.
Grammatical Range and Accuracy: Band 4.5
The response relies mostly on short, simple statements, and frequent errors affect clarity. For example, “In this report has one bar chart” lacks a grammatical subject, while “this chart show” has incorrect subject–verb agreement. Articles and sentence structure are also problematic in “I describe the some cities,” and several sentences run together without appropriate spaces or punctuation, such as the transition from the introduction to “In this chart.” There is an attempt to connect ideas with “so” and “after that,” but the range of sentence forms remains very limited and these links do not produce accurate complex sentences. Practise complete subject–verb sentences, consistent punctuation, and simple comparisons such as “China produced more electricity than it consumed.”
See this exact question answered at other band scores. The same prompt compared across bands.
Browse more IELTS Writing model answers or get your own writing scored by the same AI examiner.