Band 5.5 IELTS Writing Task 1 Model Answer
Overall Band Score: 5.5 · Cambridge IELTS 13 · 2026-11-16
IELTS Writing Task 1 question
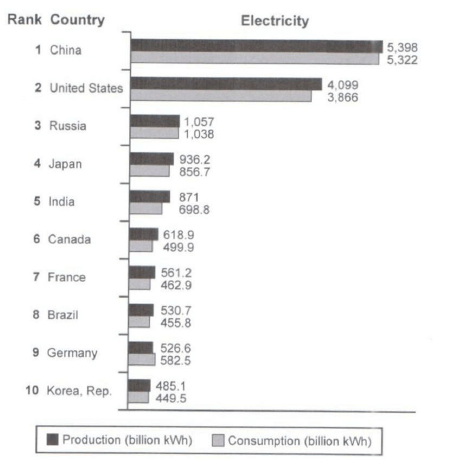
The bar chart below shows the top ten countries for the production and consumption of electricity in 2014.
Summarize the information by selecting and reporting the main features, and make comparisons where relevant.
Student answer (Band 5.5)
This chart illustrates the production and consumption of electricity of the top ten countries in 2014.
Overall it can be seen that the highest consumption and production of electricity were in China and United States. Other countries had produced and consumed less electricity than China and United States.
To commence with, China had produced electricity of five thousand three hundred ninety eight billion kWH and consumed five thousand three hundred twenty two billion kWH whereas United States had produced four thousand ninety nine billion kWH and consumed three thousand eight hundred sixty six billion kWH. Russia had produced one thousand fifty seven billion kWH and consumed one thousand thirty eigth billion kWH.
Moreover, Japan produced nine hundred thirty six point two billion kWH and consumed eight hundred fifty six point seven billion kWH, India had produced eight hundred seventy one billion kWH and consumed six hundred ninety eight point eight billion kWH, Canada had produced six hundred eighteen point nine billion kWH and consumed four hundred ninety nine point nine billion kWH, France produced five hundred sixty one point two billion kWH and consumed four hundred sixty two point nine billion kWH. Brazil had produced five hundred thirty point seven billion kWH and consumed four hundred fifty five point eight billion kWH, Germany had produced five hundred twenty six point six billion kWH and consumed five hundred eighty two point five billion kWH and Korea,Rep had produced four hundred eighty five point one billion kWH and consumed four hundred forty nine point five billion kWH.
AI examiner evaluation
| Criterion | Band |
|---|---|
| Task Achievement / Task Response | 5.5 |
| Coherence and Cohesion | 6.0 |
| Lexical Resource | 5.5 |
| Grammatical Range and Accuracy | 5.5 |
| Overall | 5.5 |
Task Achievement / Task Response: Band 5.5
You identify the chart’s subject and give a relevant overview, correctly noting that China and the United States lead both production and consumption. You also report figures for all ten countries, and the values are generally accurate, including Germany’s higher consumption than production. However, the overview is limited: “Other countries had produced and consumed less” does not highlight the substantial gap between the top two countries and the rest, or the general pattern that production exceeds consumption in most countries. The response mainly lists figures rather than selecting and comparing the most significant features. To strengthen the report, group the middle and lower-ranking countries and draw out notable contrasts, especially Germany as the exception to the usual production-consumption pattern.
Coherence and Cohesion: Band 6.0
The response has a clear basic structure: an introduction, an overview, and two paragraphs of data. The sequence from China and the United States to the remaining countries is easy to follow, and linking expressions such as “Overall,” “whereas,” and “Moreover” help signal relationships. However, the final paragraph becomes a long list of figures, so comparisons and key patterns are difficult to distinguish. “Moreover” introduces more data but does not show how the countries relate to one another, and the repeated “had produced … and consumed …” pattern makes the progression mechanical. Grouping countries by output level or highlighting shared patterns would create clearer development, while shorter sentences and more purposeful comparisons would improve cohesion.
Lexical Resource: Band 5.5
You use relevant vocabulary for describing the chart, including “production,” “consumption,” “highest,” and “whereas,” and the meaning of the figures is generally clear. However, the range is limited by repeated use of “produced” and “consumed,” and several expressions are awkward for formal data reporting, such as “had produced electricity of” and “Other countries had produced and consumed less.” The spelling “eigth” is also inaccurate, and “kWH” is not the standard presentation of the unit; use “kWh.” More precise reporting language and varied comparison phrases would make the account more natural. For example, describe figures as “stood at” a value, or say that one country’s consumption “was lower than” its production.
Grammatical Range and Accuracy: Band 5.5
You attempt a mix of sentence forms, including a complex comparison with “whereas” and a list joined by “and,” and the main information remains understandable. Some grammatical choices are not well controlled, however. The past perfect in “had produced” is unnecessary when describing a single year; the simple past (“produced”) is more appropriate. In “the highest consumption and production … were in China and United States,” the article is missing before “United States.” The long final sentence also strings together many clauses, making punctuation and sentence boundaries harder to manage. Use a consistent simple past, add the required article, and divide the data into shorter sentences. These changes would improve accuracy while allowing you to retain complex comparisons.
See this exact question answered at other band scores. The same prompt compared across bands.
Browse more IELTS Writing model answers or get your own writing scored by the same AI examiner.