Band 5.5 IELTS Writing Task 1 Model Answer
Overall Band Score: 5.5 · Cambridge IELTS 13 · 2026-11-18
IELTS Writing Task 1 question
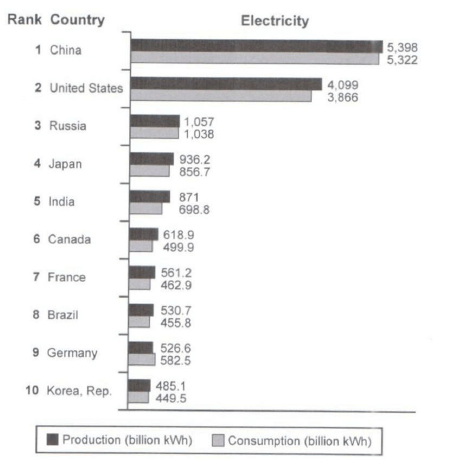
The bar chart below shows the top ten countries for the production and consumption of electricity in 2014.
Summarize the information by selecting and reporting the main features, and make comparisons where relevant.
Student answer (Band 5.5)
The bar chart demonstrate the range of electricity genration and usage in top ten countries in 2014 by comparing them.
Overall, in China, and the US power usage and production were significantly higher than all other countries, in contrast Korea has the lowest electricity demand and supply.
China produce and use the substantial percentage of electricity 5,398, and 5,322 billion kWh respectively, in the US 4,099 billion kWh electricity was produced, and 3,866 billion kWh is used. A stark contrast was evident in US where about 4,099 billion kWh power is genrated, while 3,866 billion kWh was consumed in 2014. A drastic drop in electricity usage and production was seen in all the remaining countries as compared to the US, and China, the electricity production in India, Japan, and Canada was 963.2, 871, and 618.9 billion kWh respectively; meanwhile, the ratio of usage in thev follse countries were 856.7, 698.8, and 499.9 billion kWh respectively. In France , Canada, and Germany the proportion of electricity usage and production were 500 to 450 billion kWh. Comparatively Korea had lower demand and production about 485.1, and 449.5 billion kWh.
AI examiner evaluation
| Criterion | Band |
|---|---|
| Task Achievement / Task Response | 5.5 |
| Coherence and Cohesion | 5.0 |
| Lexical Resource | 6.0 |
| Grammatical Range and Accuracy | 5.5 |
| Overall | 5.5 |
Task Achievement / Task Response: Band 5.5
You identify the main pattern that China and the United States lead production and consumption, and you note that Korea is at the bottom. Several figures are reported accurately, including China’s values and the US consumption figure. However, coverage of the remaining countries is incomplete and some details are inaccurate: Japan’s production is given as 963.2 rather than 936.2, and the statement that France, Canada and Germany are all around 500 to 450 billion kWh does not reflect Germany’s consumption of 582.5. The overview could also capture the broad production-consumption relationship more clearly. Select a few key comparisons and report them precisely, rather than grouping unlike figures.
Coherence and Cohesion: Band 5.0
The response has an overall structure, moving from an introduction and overview to supporting figures, and connectors such as “Overall,” “meanwhile” and “Comparatively” help signal relationships. However, progression becomes difficult to follow in the long middle section: the US comparison is repeated, and the sentence beginning “A drastic drop” combines several countries and figures without clear matching. The final comparison also groups France, Canada and Germany in a way that obscures which values belong to which country. Use separate paragraphs for the overview and details, organise the figures in a consistent order, and avoid repeating the same comparison. Clearer referencing would make the information easier to track.
Lexical Resource: Band 6.0
You use a reasonable range of task-related vocabulary, including “production,” “consumed,” “stark contrast,” “demand” and “drastic drop,” so the main topic is generally clear. Some less common choices are not fully natural or precise: “substantial percentage of electricity” is unsuitable for values expressed as amounts, and “ratio of usage” does not accurately describe the consumption figures. There are also spelling errors such as “genration,” “genrated” and “follse,” alongside inconsistent forms such as “produce” for past data. Choose standard chart language such as “amount,” “figure” and “consumption,” and proofread spelling and word forms to improve precision.
Grammatical Range and Accuracy: Band 5.5
You attempt both simple and more complex sentence forms, including comparisons introduced by “while” and “as compared to.” However, some errors in sentence structure and grammatical control remain. The opening “The bar chart demonstrate” has subject–verb disagreement, and “China produce and use” does not maintain the past tense needed for 2014 data. The sentence beginning “A drastic drop … was seen” is overloaded, making the relationship between its clauses and figures unclear. Articles and punctuation are also inconsistent, as in “in the US” and the spacing around commas. Use consistent past-tense reporting, check agreement, and divide long sentences so each comparison has a clear grammatical structure.
See this exact question answered at other band scores. The same prompt compared across bands.
Browse more IELTS Writing model answers or get your own writing scored by the same AI examiner.