Band 6.0 IELTS Writing Task 1 Model Answer
Overall Band Score: 6.0 · Cambridge IELTS 13 · 2026-11-19
IELTS Writing Task 1 question
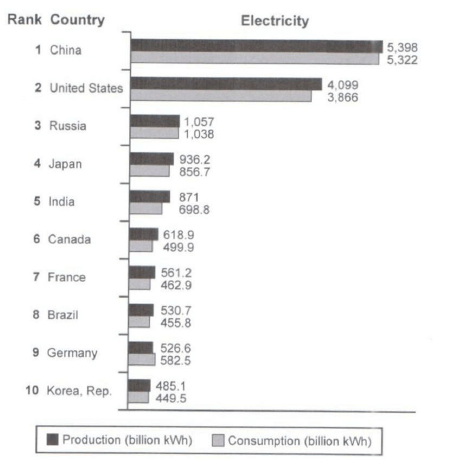
The bar chart below shows the top ten countries for the production and consumption of electricity in 2014.
Summarize the information by selecting and reporting the main features, and make comparisons where relevant.
Student answer (Band 6.0)
The multiple bar chart compares the data of how much electricity measured in billion killowatt hour was produced and consumed in the year 2014 in ten selected countries.
As can be seen, China leads among all in production and consumption of electricity. All countries except Germany consumed more electricity as compared to its production.
In 2014, total 5,398 billion kwh electricity was produced while 5,322 billion kwh was consumed in China. Both of them was highest figures in the given year. In the US, electricity consumption and production was 3,866 and 4099 billion kwh respectively. There was a narrow difference between Russia's electricity consumption (1038 billion kwh) and production (1057 billion kwh). Other countries Japan, India, Canada, France, Brazil also produced more electricity as compared to their consumption and their figures are all below 1000 billion kwh. Korea consumed the least amount of energy which was just 449.5 billion kwh and produced billion 485.1kwh in 2014.
Germany is the only country in the list which consumed more electricity as compared to its production. 526.6 billion kwh electricity was produced while surprisingly 582.5 billion kwh electricity was consumed in the given year.
AI examiner evaluation
| Criterion | Band |
|---|---|
| Task Achievement / Task Response | 6.0 |
| Coherence and Cohesion | 6.5 |
| Lexical Resource | 6.0 |
| Grammatical Range and Accuracy | 6.0 |
| Overall | 6.0 |
Task Achievement / Task Response: Band 6.0
The response identifies the main pattern accurately: China is highest in both measures, and Germany is the only country where consumption exceeds production. It also reports several figures correctly, including China’s totals and Germany’s production and consumption, and groups the other countries as producing more than they consume. However, some comparisons are less fully developed: the statement that the figures for Japan, India, Canada, France and Brazil are all below 1,000 does not show how their values compare with one another, and the US figures would be clearer if production and consumption were explicitly matched to each number. The overview is relevant, but could better highlight the large gap between China and the US and the much lower figures for the remaining countries. This leaves some key features under-explained.
Coherence and Cohesion: Band 6.5
The response has a clear overall arrangement: an introduction, a brief overview, and paragraphs that move from the leading countries to the smaller producers and then Germany’s exception. This logical progression makes the information easy to follow. Linking phrases such as “As can be seen,” “In 2014,” and “Germany is the only country” help signal the stages of the description. Some connections are less precise or slightly mechanical, however. For example, “Both of them was highest figures” does not clearly refer to the production and consumption values, and “Other countries Japan, India…” introduces a list abruptly. The overview and body also repeat the Germany exception. More precise referencing and smoother transitions between grouped comparisons would make cohesion more flexible and less repetitive.
Lexical Resource: Band 6.0
The vocabulary is adequate for describing the chart, with useful terms such as “produced,” “consumed,” “narrow difference,” “leads,” and “figures.” The writer also uses relevant measurement language and communicates the comparisons without major ambiguity. However, some word choices and collocations are inaccurate or awkward, including “compares the data of how much electricity,” “leads among all,” and “consumed more electricity as compared to its production.” “Killowatt” is misspelled, and the unit is not expressed consistently. Repeated use of “electricity,” “produced,” and “consumed” also limits flexibility. Aim for more natural chart language, such as “compares electricity production and consumption” and “ranked first,” while checking spelling and using varied but precise comparison terms.
Grammatical Range and Accuracy: Band 6.0
The response includes a mix of simple and more complex sentence forms, including a subordinate clause in “All countries except Germany consumed more electricity…” and a relative clause in “which consumed more electricity…”. Most meanings remain clear, and the figures are generally presented in understandable sentences. Some grammatical errors persist, particularly with subject–verb agreement and sentence construction: “Both of them was highest figures” should be “Both were the highest figures,” while “electricity consumption and production was” requires a plural verb. The opening phrase “how much electricity measured…” is also structurally awkward, and “total 5,398…” needs a more complete construction, such as “a total of 5,398…”. Greater control of agreement and complete noun phrases would improve accuracy while retaining the range of structures attempted.
See this exact question answered at other band scores. The same prompt compared across bands.
Browse more IELTS Writing model answers or get your own writing scored by the same AI examiner.