Band 4.5 IELTS Writing Task 1 Model Answer
Overall Band Score: 4.5 · Cambridge IELTS 13 · 2026-11-19
IELTS Writing Task 1 question
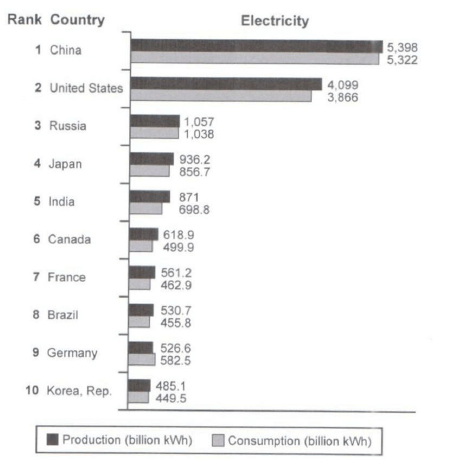
The bar chart below shows the top ten countries for the production and consumption of electricity in 2014.
Summarize the information by selecting and reporting the main features, and make comparisons where relevant.
Student answer (Band 4.5)
The given bar chart illustrate the information about the top then countries for the production and consumption of electricity in 2014.
In this bar chart on the X-axis i can see the names of countries such as China, United States, Russia, Japan, India, Canada, France, brazil, Germany and Korea and on Y-axis the units of electricity, in whish the highest electricity consumed and produced by China, the amount of these units are 5322kWh and 5398kWh.
on the other hand, the lowest part coverd by Corea, the comsumption is 449.5kWh and the production in 485.1kWh.
Moreover, the second largest amount covert by United States and then next is Russia, wherever India is number 5 and Japan is on number 4.
In conclusion, the chart gives more information anout the top ten countries for the production and consumption of electricity in 2014.
AI examiner evaluation
| Criterion | Band |
|---|---|
| Task Achievement / Task Response | 4.0 |
| Coherence and Cohesion | 4.5 |
| Lexical Resource | 5.0 |
| Grammatical Range and Accuracy | 4.5 |
| Overall | 4.5 |
Task Achievement / Task Response: Band 4.0
You identify the chart’s subject and report several relevant facts, including China’s highest production and consumption figures and Korea’s lowest figures. You also note the United States and Russia as the next major producers. However, the response is only 117 words, below the required 150, and this limits how fully you can summarise the data. The overview is incomplete: it does not clearly compare the overall scale of the leading countries with the rest, or note that production exceeds consumption in most countries while Germany is the exception. Some details are also imprecise, such as calling Korea the lowest without specifying that this applies to both measures. Develop the key comparisons and include accurate supporting figures.
Coherence and Cohesion: Band 4.5
The response has a basic sequence: an introduction, selected details, and a concluding sentence. Linking expressions such as “on the other hand,” “Moreover,” and “In conclusion” show an attempt to connect ideas. However, the progression is not consistently clear: the contrast introduced by “on the other hand” does not explain what is being contrasted, and the final sentence largely repeats the introduction rather than drawing together the main features. The second paragraph also combines axis description, the highest figures, and the lowest figures without a clear organising principle. Use separate paragraphs for an overview and grouped comparisons, and make each linking phrase express a genuine relationship between the information.
Lexical Resource: Band 5.0
You use some relevant chart vocabulary, including “production,” “consumption,” “amount,” and “second largest,” so the reader can understand the general topic and several comparisons. However, the range is limited and some word choices or spellings reduce precision: “top then countries,” “lowest part coverd,” and “amount covert” are unclear or inaccurate. “Units” is also less precise than “figures” or “output” when describing the values. Repeated use of “amount” and “information” makes the description less specific. Aim to use standard data-reporting phrases such as “ranked first,” “recorded,” and “the figure for consumption,” and check spelling carefully, especially for country names and key terms.
Grammatical Range and Accuracy: Band 4.5
You attempt both simple statements and longer sentences, and the main message is generally recoverable. However, grammatical errors occur frequently and sometimes make relationships between ideas difficult to follow. For example, “The given bar chart illustrate” has subject–verb disagreement, while “the highest electricity consumed and produced by China” lacks a clear grammatical structure. The sentence beginning “In this bar chart on the X-axis…” is also awkwardly joined and contains unclear clause construction. Capitalisation and punctuation are inconsistent, including lowercase “i” and a long sentence beginning “on the other hand.” Practise accurate simple comparison structures first, such as “China produced…” and “Its consumption was…”, then combine them with controlled clauses using “while” or “whereas.”
See this exact question answered at other band scores. The same prompt compared across bands.
Browse more IELTS Writing model answers or get your own writing scored by the same AI examiner.