Band 5.5 IELTS Writing Task 1 Model Answer
Overall Band Score: 5.5 · Cambridge IELTS 13 · 2026-11-20
IELTS Writing Task 1 question
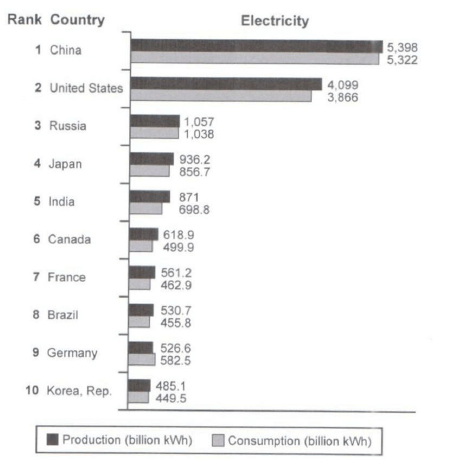
The bar chart below shows the top ten countries for the production and consumption of electricity in 2014.
Summarize the information by selecting and reporting the main features, and make comparisons where relevant.
Student answer (Band 5.5)
Top 10 Countries Producing And Consuming Electricity In 2014.
The given chart illustrates the top ten countries that are producing and consuming electricity in a ranking form. Each country has two sections showing how much electricity (in billion kilo watts an hour) hass been used in the year 2014.
On the top of the chart is China with most consumption, producing 5,389 billion kWh of electricity and consumed 5,322 of it. United States Of America has been listed at second position with 4,099 units of billion kWh production and 3,866 consumed by residents.
After these two mega countries, on the third position comes the largest country by land, Russia, producing 1,057 billion kWh and consumed 1,038 of them. On fourth position is Japan with 936.2 billion kWh produced and 856.7 consumed in 2014. On fifth place comes India with the largest population in the world, produced 871 billion kWh and consumed 698.8 billion kWh of them.
The last five countries are Canada, France, Brazil, Germany and Republic of Korea producing less than 700 billion kWh and consumed a decent amount of it.
AI examiner evaluation
| Criterion | Band |
|---|---|
| Task Achievement / Task Response | 4.5 |
| Coherence and Cohesion | 6.0 |
| Lexical Resource | 5.5 |
| Grammatical Range and Accuracy | 5.5 |
| Overall | 5.5 |
Task Achievement / Task Response: Band 4.5
You identify the chart’s subject and report several key figures accurately, including the United States, Russia, Japan and India. However, the response gives little overall summary of the main pattern: China and the United States are far ahead, while the other countries produce and consume much less. The overview is also weakened by the inaccurate production figure for China (5,389 rather than 5,398). The final group is only described broadly, and the claim that each consumed “a decent amount” does not make a meaningful comparison; Germany is especially important because its consumption exceeds its production. Personal details such as Russia’s land area and India’s population do not help summarize the chart. Select and compare the most significant features more clearly.
Coherence and Cohesion: Band 6.0
The response is arranged in a generally understandable sequence: it introduces the chart, discusses the leading countries, and then groups the remaining five. This gives the reader a basic progression, and phrases such as “After these two” and “On fourth position” help signal movement through the rankings. However, the organisation follows the list mechanically rather than building a clear overview and then supporting it with selected comparisons. The final sentence groups five countries together without explaining their differences, and “a decent amount” leaves the comparison unclear. A separate overview paragraph followed by paragraphs comparing the highest and lower figures would make the progression more purposeful. Use linking language to show contrasts, not just rank order.
Lexical Resource: Band 5.5
You use relevant chart vocabulary, including “production,” “consumption,” “billion kWh,” and “listed at second position,” so the topic is generally clear. There is some variety in how you describe the figures, but several choices are imprecise or informal for an academic report. “Mega countries” is conversational, while “a decent amount” is vague and does not convey a measurable comparison. “Billion kilo watts an hour” is also an inaccurate rendering of the chart’s unit; use “billion kilowatt-hours.” The phrase “producing and consuming” is repeated, and “sections” is not a precise description of the two data series. Aim for concise, accurate terms such as “generated,” “used,” “slightly higher,” and “substantially lower.”
Grammatical Range and Accuracy: Band 5.5
The response includes both simple statements and longer sentences, and most of the figures remain understandable despite some grammatical problems. However, verb forms are not consistently controlled when describing production and consumption. For example, “producing 5,389 … and consumed 5,322” mixes a participle with a past-tense verb; “produced … and consumed” would be parallel. The same pattern appears in the descriptions of Russia and India. There are also awkward sentence constructions such as “On fifth place comes India with the largest population in the world, produced…” and inconsistent capitalization in “United States Of America.” Use complete, parallel clauses and check articles and punctuation. More accurate complex sentences would help you compare the two measures without sacrificing clarity.
See this exact question answered at other band scores. The same prompt compared across bands.
Browse more IELTS Writing model answers or get your own writing scored by the same AI examiner.