Band 5.5 IELTS Writing Task 1 Model Answer
Overall Band Score: 5.5 · Cambridge IELTS 13 · 2026-11-20
IELTS Writing Task 1 question
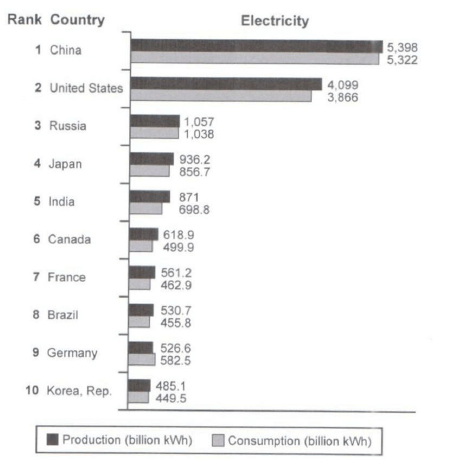
The bar chart below shows the top ten countries for the production and consumption of electricity in 2014.
Summarize the information by selecting and reporting the main features, and make comparisons where relevant.
Student answer (Band 5.5)
Details of the top ten Nations regarding to how much production and consumption they did of electric energy in the year of 2014 are delineaghted by the given bar chart.
Overall, at the first prima facia glance, it can be observe, most of the countries producese more electricity then they consume. Among all these nations, China holds the highest rank in both production and consumption while Korea, Rep has the lowest numbers in both those categories.
Digging deeper into the obtainable information, China has total 5398kWh of production 5322kWH of consumption which gave it the first rank. After following china, United States has the closesest number which are 3099 for production and 3866 for consumption.
Furthermore, we can see that there is a huge fall of nearly 2000kWh between the rank 2 and 3 and that makes the russia at rank 3 with numbers of 1057 and 1038kWh of production and consumption respectively. Now Japan and India has 936.2 kwh and 871 production and 857.7 and 698.8 kwh of consumption.
Moreover, canada, france,brazil have almsot similar trend. the total of all these three countires is still less in numbers then the US in both categories. Apart from these all, Germany was the only nation who consumes more electricity then it produces and at the bottom Korea Rep. holds the 10th rank with the production and consumption of 458.1 and 449.5kwh respectively.
Hereby, i conclude my report.
AI examiner evaluation
| Criterion | Band |
|---|---|
| Task Achievement / Task Response | 6.0 |
| Coherence and Cohesion | 6.0 |
| Lexical Resource | 5.5 |
| Grammatical Range and Accuracy | 5.0 |
| Overall | 5.5 |
Task Achievement / Task Response: Band 6.0
You identify the main pattern accurately: China leads both measures, Korea is lowest, and Germany is the exception where consumption exceeds production. You also select useful comparisons, including the sharp drop from the United States to Russia and the relatively similar figures for Canada, France and Brazil. However, several figures are inaccurate: US production is 4,099, not 3,099, and Korea’s production is 485.1, not 458.1. Japan’s consumption is 856.7 rather than 857.7. The overview is relevant, but the discussion of the middle-ranked countries is less fully developed, and the closing “Hereby, I conclude my report” does not add chart information. More precise reporting and fuller comparison of the figures would strengthen the response.
Coherence and Cohesion: Band 6.0
The response has a recognisable structure: an introduction, an overview, and paragraphs that move from the leading countries to the lower-ranked ones. This gives the reader a generally coherent route through the data. Some linking is effective, such as “Furthermore” and “Moreover,” but transitions are sometimes mechanical or awkward: “After following china” and “Apart from these all” do not clearly express the relationships between points. The paragraph on Canada, France and Brazil groups them without reporting their individual figures, so the progression becomes less informative. The final sentence is also an unnecessary report-style sign-off. Use clearer comparisons to connect each paragraph and organise the data into meaningful groups.
Lexical Resource: Band 5.5
You attempt a range of vocabulary, including “holds the highest rank,” “huge fall,” and “similar trend,” and the general topic remains understandable. However, several choices are inaccurate, overly elaborate, or unsuitable for a concise chart report: “first prima facia glance,” “obtainable information,” and “Digging deeper” sound unnatural in this context. Spelling errors such as “delineaghted,” “closesest,” “almsot,” and “countires” also reduce precision. Some collocations are unclear, including “how much production and consumption they did.” Prefer direct, conventional language for describing data, and check spelling and word forms carefully. This would make your vocabulary more accurate and appropriately formal.
Grammatical Range and Accuracy: Band 5.0
You use both simple statements and attempts at longer structures, and the overall meaning is usually recoverable. However, errors in sentence construction and agreement occur across the response. For example, “it can be observe” needs a passive participle, while “most of the countries producese more” has incorrect verb form and agreement. In “China has total 5398kWh of production 5322kWH of consumption,” the relationship between the two figures is not grammatically expressed. There are also problems with articles, plurals and punctuation, as in “Japan and India has” and the run-on list of figures that follows. Build more controlled sentences around comparisons, and check verb forms, sentence boundaries and punctuation.
See this exact question answered at other band scores. The same prompt compared across bands.
Browse more IELTS Writing model answers or get your own writing scored by the same AI examiner.