Band 6.0 IELTS Writing Task 1 Model Answer
Overall Band Score: 6.0 · Cambridge IELTS 13 · 2026-11-20
IELTS Writing Task 1 question
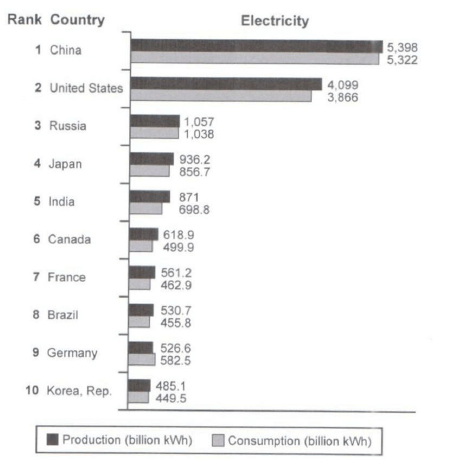
The bar chart below shows the top ten countries for the production and consumption of electricity in 2014.
Summarize the information by selecting and reporting the main features, and make comparisons where relevant.
Student answer (Band 6.0)
The bar chart illustrate the highest 10 countries in production and consumptin of electricity in 2014.
Overall, it was evident China has the highest record in producing and consuming the electricity. While Korea report the lowest figure in generating and using of light. \
Looking into details, China reached a peak with 5,398 in supplying and spending 5322 electricity. Whereas, United States numbers was lower then China but record the second highest using country for electricity, the production of electricty of usa was 4,099 which was more then the consumed numbers 3,866. The electrcity usage is 1038 and generating is 1,057 in Russia which is almost the same. According to the population Japan is using 856.7 which consider to be less electricty in compare to russia and producing more then the consumption 936.7
Futhermore, the remaining countries, such as India, Canada, France, Brazil, was producing more eletricity rather than consuming. But Germany is the onlt country shown in the chart who's rate of consumption is more then the production rate. Lastly korea displayed the lowest rate in comparision with all of the above contry in both production and consumption of electricty.
AI examiner evaluation
| Criterion | Band |
|---|---|
| Task Achievement / Task Response | 6.5 |
| Coherence and Cohesion | 6.5 |
| Lexical Resource | 5.0 |
| Grammatical Range and Accuracy | 5.0 |
| Overall | 6.0 |
Task Achievement / Task Response: Band 6.5
You identify the main pattern accurately: China leads both measures, Korea is lowest, and Germany is the exception where consumption exceeds production. You also include several relevant comparisons, such as the United States’ second-place position and Russia’s similar figures. This covers the task well overall, while some details are less fully or precisely reported: Japan’s production is given as 936.7 rather than 936.2, and the phrase “According to the population” introduces an unsupported comparison. The overview could also summarise the broad gap between the top two countries and the remaining nations more clearly. To strengthen the response, select the most important contrasts and report figures accurately, without adding explanations not shown by the chart.
Coherence and Cohesion: Band 6.5
The response has a clear overall arrangement, with an introduction, an overview, and two detail paragraphs. Its progression from the leading countries to the remaining group is generally easy to follow, and transitions such as “Overall,” “Looking into details,” and “Furthermore” help signal movement between points. However, some links are mechanical or do not clearly express the relationship between ideas. For example, “Whereas” begins a fragment-like transition, and the long sentence about the United States combines ranking, production, and consumption without smooth control. Grouping the figures more consistently—for example, discussing the top two, then the middle group, then Germany and Korea—would make the comparisons more cohesive and precise.
Lexical Resource: Band 5.0
You use enough topic-related vocabulary to communicate the chart’s main information, including “production,” “consuming,” “generating,” and “consumption.” However, the range is limited and several choices are inaccurate or unnatural, which makes some descriptions less clear. “Using of light” is not an appropriate way to describe electricity consumption, while “spending” suggests money rather than energy use. There are also noticeable spelling errors, including “consumptin,” “electrcity,” “Futhermore,” and “contry.” Aim for precise, repeated chart language rather than searching for synonyms that do not fit the context. Accurate terms such as “electricity generation,” “electricity consumption,” and “figure” would improve clarity and formality.
Grammatical Range and Accuracy: Band 5.0
You attempt a mixture of simple and more complex sentences, including a contrast with “While” and a comparison using “rather than.” However, control is uneven, and errors in sentence structure, agreement, articles, and punctuation sometimes make the reader work to understand the meaning. For example, “The bar chart illustrate” has subject–verb disagreement, and “United States numbers was lower” has an incorrect verb form. “While Korea report the lowest figure…” is also not a complete, well-controlled contrast in this context. Some sentences run together, particularly the discussion of the United States. Practise accurate basic sentence patterns first, then use subordinate clauses and contrast structures with correct agreement and punctuation.
See this exact question answered at other band scores. The same prompt compared across bands.
Browse more IELTS Writing model answers or get your own writing scored by the same AI examiner.