Band 4.0 IELTS Writing Task 1 Model Answer
Overall Band Score: 4.0 · Cambridge IELTS 13 · 2026-11-20
IELTS Writing Task 1 question
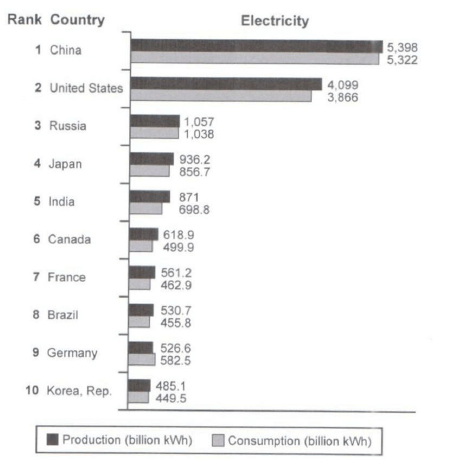
The bar chart below shows the top ten countries for the production and consumption of electricity in 2014.
Summarize the information by selecting and reporting the main features, and make comparisons where relevant.
Student answer (Band 4.0)
The bar chart presents the production as well as the consumption of few countires in 2014.
It is clear that the highest recorded figure belongs to China. Furthermore, the second most popular is United States, which has significant amount more than rest of the countries. However, the production always surpassed the amount of consumption
AI examiner evaluation
| Criterion | Band |
|---|---|
| Task Achievement / Task Response | 3.0 |
| Coherence and Cohesion | 4.5 |
| Lexical Resource | 4.5 |
| Grammatical Range and Accuracy | 4.5 |
| Overall | 4.0 |
Task Achievement / Task Response: Band 3.0
You identify two valid headline features: China has the highest figures, and the United States ranks second. However, the response reports almost none of the chart’s comparative detail, such as the sharp drop from the two leading countries to Russia and the much lower figures for the remaining countries. The statement that production “always surpassed” consumption is inaccurate: Germany consumed more electricity than it produced (582.5 versus 526.6 billion kWh). The task also requires at least 150 words, and this response is substantially below that minimum, leaving the summary incomplete. To improve, give a clear overview and support it with several accurate comparisons and selected figures.
Coherence and Cohesion: Band 4.5
The ideas follow a basic, understandable order: you introduce the chart, identify China and the United States as the leaders, and then make a general comparison between production and consumption. Linking expressions such as “Furthermore” and “However” help signal these steps. However, the response is too brief to develop a clear progression through the data, and the final claim is not supported by examples. There is also no paragraphing to distinguish an overview from supporting details. Organise the report into a short introduction, an overview of the main patterns, and a detail paragraph comparing selected countries; use linking words only where they accurately express the relationship between ideas.
Lexical Resource: Band 4.5
You use some relevant chart-reporting vocabulary, including “production,” “consumption,” “highest recorded figure,” and “surpassed,” so the topic is generally clear. However, the range is narrow and several choices are inaccurate or unnatural. “The second most popular” describes popularity rather than a ranking by electricity output, while “significant amount more” is an awkward way to express a numerical difference. The spelling “countires” also reduces accuracy. Use precise terms such as “second-highest producer” and “considerably higher,” and refer to “figures” or “output” when comparing quantities. A wider set of accurate comparison phrases would make the report more suitable for an academic chart summary.
Grammatical Range and Accuracy: Band 4.5
The response includes a few complete sentence forms, including the opening sentence and the clause “which has significant amount more than rest of the countries.” The use of “which” shows an attempt to add a relative clause, and the main meaning is usually recoverable. However, the range is very limited, with most ideas expressed in short, simple statements, and there are errors in sentence construction and articles. For example, “has significant amount more” needs an article before “significant amount,” and “than rest of the countries” needs “the.” The final sentence also makes a broad claim without a qualifying structure. Practise accurate comparative sentences with figures, alongside a mix of simple and complex forms.
See this exact question answered at other band scores. The same prompt compared across bands.
Browse more IELTS Writing model answers or get your own writing scored by the same AI examiner.