Band 5.0 IELTS Writing Task 1 Model Answer
Overall Band Score: 5.0 · Cambridge IELTS 13 · 2026-11-21
IELTS Writing Task 1 question
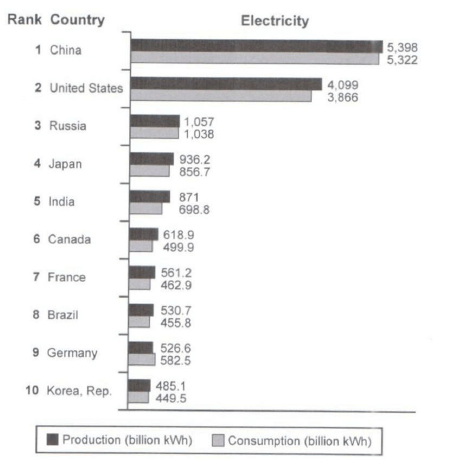
The bar chart below shows the top ten countries for the production and consumption of electricity in 2014.
Summarize the information by selecting and reporting the main features, and make comparisons where relevant.
Student answer (Band 5.0)
The bar chart illustrates the production and consumption of electricity in 2014, and difference about the production and consumption of electricity between world top 10 highest countries.
Overall, We see that in the bar chart China illustrates high production and consumption. And Korea illustrates lowest production and consumption in 2014. But Japan, India, Canada illustrates normal production and consumption in 2014.
China illustrates production and consumption of electricity in 2014. Total production is 5,398(billion KWh) and consumption is 5,322(billion KWh). United States production of electricity is 4,099(billion KWh) and consumption of electricity is 3,866(billion KWh) in 2014. Russia production is 1,057(billion KWh) and consumption is 1,038(billion KWh). While Japan production and consumption in 2014 is 936.2(billion KWh) and 856.7(billion KWh). India production is 871(billion KWh) and consumption is 698.8(billion KWh) in 2014. Canada production of electricity is 618.9(billion KWh) in 2014 and consumption is 499.9(billion KWh) in 2014. France production and consumption in 2014 is 561.2(billion KWh) and 462,9(billion KWh). Brazil production is 530.7(billion KWh) and consumption is 455.8(billion KWh). Germany illustrates 526.6(billion KWh) production and 582.5(billion KWh) consumption in 2014. At the end Korea production of electricity in 2014 is 485.1(billion KWh) and consumption is 449.5(billion KWh).
AI examiner evaluation
| Criterion | Band |
|---|---|
| Task Achievement / Task Response | 5.0 |
| Coherence and Cohesion | 5.5 |
| Lexical Resource | 5.0 |
| Grammatical Range and Accuracy | 5.0 |
| Overall | 5.0 |
Task Achievement / Task Response: Band 5.0
You identify the chart’s subject and give a clear broad comparison: China has the highest production and consumption, while Korea is among the lowest. You also report figures for all ten countries, and most match the chart. However, the overview is limited: calling Japan, India and Canada “normal” does not explain a meaningful pattern, and you do not highlight the large gap between the top two countries and the rest. Germany is an important exception because consumption (582.5) exceeds production (526.6), but this is only listed rather than interpreted. Develop a more informative overview and select key comparisons, rather than mainly presenting a country-by-country inventory.
Coherence and Cohesion: Band 5.5
The response has a basic overall structure, moving from an introduction and overview to the figures, and the country-by-country sequence is generally easy to follow. However, progression is limited because the main body reads as a long list of similar statements, with little grouping or comparison. Connect related countries—for example, compare China and the United States with the much lower figures for the remaining countries—and use paragraphing to separate the overview from grouped details. Linking is also repetitive: “and,” “in 2014,” and repeated country-name openings do much of the work. The opening “While Japan…” is not smoothly connected to the preceding sentence, so transitions need more careful control.
Lexical Resource: Band 5.0
Your vocabulary is sufficient to identify the chart and its data, using terms such as “production,” “consumption,” and “illustrates.” However, the range is limited and several expressions are repeated, especially “production of electricity” and “in 2014.” Some word choices are imprecise or unnatural: “difference about” does not clearly express the comparison, and “normal production and consumption” is vague and not an appropriate description of the figures. “At the end” is also an awkward way to introduce the final country. Use a wider set of accurate comparison terms, such as “exceeded,” “was slightly higher than,” and “by contrast,” and choose precise language for the overview.
Grammatical Range and Accuracy: Band 5.0
You communicate the figures, but the response relies heavily on short, repetitive sentence patterns, with limited evidence of controlled complex structures. Several sentences omit or misplace grammatical elements, as in “Russia production is 1,057” and “China illustrates production and consumption,” where the intended relationship is not expressed naturally. The overview also has agreement problems in “Japan, India, Canada illustrates,” and the opening sentence is awkwardly constructed. Capitalisation is inconsistent (“We”), and punctuation around the figures is not well controlled. Practise accurate possessive or “of” constructions, subject–verb agreement, and varied sentence forms. For example, combine related data in a correctly structured comparison rather than repeating the same sentence frame.
See this exact question answered at other band scores. The same prompt compared across bands.
Browse more IELTS Writing model answers or get your own writing scored by the same AI examiner.