Band 5.5 IELTS Writing Task 1 Model Answer
Overall Band Score: 5.5 · Cambridge IELTS 13 · 2026-11-21
IELTS Writing Task 1 question
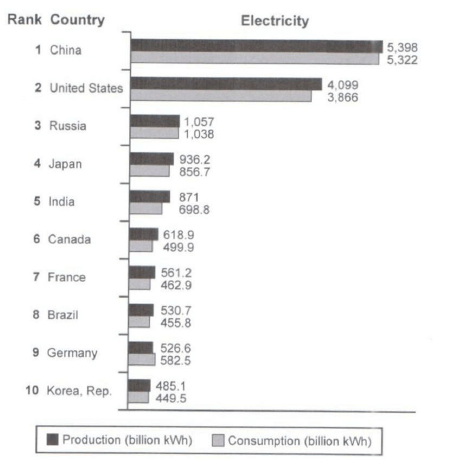
The bar chart below shows the top ten countries for the production and consumption of electricity in 2014.
Summarize the information by selecting and reporting the main features, and make comparisons where relevant.
Student answer (Band 5.5)
The provided bar chart illustrates the information about for the production and consumption of electricity in China, United States, Russia, Japan, India, Canada, France, Brazil, Germany, Korea,Rep in 2014. The numbers is measure in billion kWh.
Overall, The most highest production and consumption of electricity in China from top ten counturies. The middle range of production and consumption in Russia. The most lowest production and consumption of electricity in Korea,Rep.
In 2014, The China electricity production and consumption was 5,398 and 5,322 kWh. In United states it was about 4,099 and 3,866 kWh. Morever, In Russia production and consumption of electricity is about 1.057 and 1.038 kWh. Next, In Japan its was is approximately 936.2 and 856.7 kWh. Further more, In India the production and consumption of electricity is 871 and 698.8 kWh. In Canada and Germany its was approximately little differance 618.9 and 499.9 kwh and 526.6 and 582.5 kWh. In 2014, France, Brazil and korea production and consumption of electricty is remain 561.2 and 462.9 and 530.7 and 455.8 and 485.1 and 449.5 kWh.
AI examiner evaluation
| Criterion | Band |
|---|---|
| Task Achievement / Task Response | 5.5 |
| Coherence and Cohesion | 6.0 |
| Lexical Resource | 5.0 |
| Grammatical Range and Accuracy | 5.0 |
| Overall | 5.5 |
Task Achievement / Task Response: Band 5.5
You identify the chart’s subject and give a clear broad overview: China leads both measures, while Korea has the lowest figures, and Russia is among the middle-ranking countries. Most reported figures match the chart, including the values for China, the United States and Germany. However, the overview is incomplete: it does not highlight the large gap between the top two countries and the rest, or the notable exception that Germany consumes more electricity than it produces. The country-by-country reporting is also difficult to interpret in places; for example, “1.057 and 1.038” for Russia appears to use decimal points instead of thousands separators. To strengthen the response, select the most significant comparisons and explain them clearly rather than listing nearly every figure.
Coherence and Cohesion: Band 6.0
The response has a recognisable structure, with an introduction, an overview and a paragraph of figures. Its sequence from the highest-producing countries towards the lower figures is generally understandable, and transitions such as “Next” and “Further more” help signal movement through the data. However, the final paragraph becomes a dense list, especially in the sentence combining France, Brazil and Korea, so readers must work to match each pair of numbers to its country. Some linking phrases are repetitive or mechanical, and the reference “its” is unclear when several countries are grouped together. Organise the details into clearer comparisons—for example, the two leading countries and then the remaining countries—and use shorter sentences to make the progression easier to follow.
Lexical Resource: Band 5.0
You use relevant chart vocabulary, including “production,” “consumption,” “approximately” and “billion kWh,” so the topic is generally clear. However, the range is limited and several expressions are inaccurate or unnatural, such as “The most highest,” “middle range,” and “remain.” Spelling and formatting errors—including “counturies,” “Morever,” “differance,” “electricty” and “korea,Rep”—also reduce precision. Use standard country names and consistent number formatting; for example, Russia’s figures should be written as 1,057 and 1,038, not 1.057 and 1.038. Aim for precise comparison language such as “ranked first,” “substantially lower,” and “consumed more than it produced” rather than repeating general terms.
Grammatical Range and Accuracy: Band 5.0
The response communicates its main points through mostly simple sentence patterns, but grammatical control is inconsistent. Examples include “The numbers is measure,” where subject–verb agreement and the passive form are incorrect, and “The China electricity production and consumption was,” which has problems with the article, word order and agreement. The sentence “Next, In Japan its was is approximately” contains several competing verb forms, while capitalisation after commas is also inconsistent. These errors sometimes make the data harder to interpret, particularly in the long final sentence. Practise accurate simple clauses first, then add controlled complex structures. Check subject–verb agreement, past-tense forms for the 2014 data, and sentence boundaries before submitting.
See this exact question answered at other band scores. The same prompt compared across bands.
Browse more IELTS Writing model answers or get your own writing scored by the same AI examiner.