Band 4.5 IELTS Writing Task 1 Model Answer
Overall Band Score: 4.5 · Cambridge IELTS 18 · 2026-11-06
IELTS Writing Task 1 question
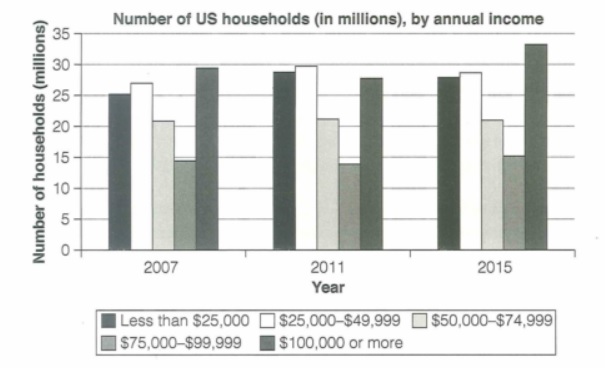
The chart below shows the number of households in the US by their annual income in 2007, 2011 and 2015.
Summarize the information by selecting and reporting the main features and make comparisons where relevant.
Student answer (Band 4.5)
The given bar graph below shows how many hauseholds in USA and how much they earn in 2007,2011 and 2015.
Overall, it can be clearly seen that householders who' s annual income was 100,000 dollers or more were highest in 2015. Whereas, householders with 75,000 to 99,999 dollers were lowest.
It can be clearly seen that 25 millions of householders have less than 25,000 dollers annual income in 2007.Allmost 27 millions of hausholders earn $25000 to $49,999.
AI examiner evaluation
| Criterion | Band |
|---|---|
| Task Achievement / Task Response | 4.0 |
| Coherence and Cohesion | 4.5 |
| Lexical Resource | 5.0 |
| Grammatical Range and Accuracy | 5.0 |
| Overall | 4.5 |
Task Achievement / Task Response: Band 4.0
The response identifies the chart’s subject and gives a relevant overall observation: households earning $100,000 or more were the largest group in 2015. It also reports two approximate 2007 figures, which are broadly consistent with the chart. However, the overview is incomplete and partly inaccurate: the $75,000–$99,999 group was the smallest in 2007 and 2011, but not in 2015, when it was slightly above the $50,000–$74,999 group. Most years and income categories are not described, so the main trends and comparisons are largely missing. The response is also substantially below the required 150 words. Add a fuller overview and compare the key changes across all three years, using selected figures to support them.
Coherence and Cohesion: Band 4.5
There is a basic structure, with an opening sentence, a separate overview, and a paragraph containing figures. The ideas are generally relevant, and the use of “Overall” signals an attempt to distinguish the main picture from details. However, the response ends after two figures, so it does not develop a clear progression through the chart or group related comparisons. “Whereas” begins a fragment rather than a complete contrasting sentence, and the repeated opening “It can be clearly seen” adds little connection between ideas. Organise the body into comparisons—for example, income groups that rose or fell, followed by those that remained stable—and use complete linking sentences to show how the figures relate.
Lexical Resource: Band 5.0
The vocabulary is sufficient to identify the chart topic and communicate basic income categories, using phrases such as “bar graph,” “annual income,” and “less than 25,000 dollars.” However, the range is limited, and several spelling errors—“hauseholds,” “dollers,” “Allmost,” and “hausholders”—make the writing less polished. “Householders” is also not the most accurate term for the chart, which counts households, while “how much they earn” is imprecise because the figures show numbers of households in income bands. Use consistent, accurate terms such as “households,” “income group,” and “number of households,” and vary reporting language with verbs such as “rose,” “remained stable,” and “declined.”
Grammatical Range and Accuracy: Band 5.0
The response uses mostly simple sentence patterns, with an attempt at a relative clause in “householders who’s annual income was…” and a contrast introduced by “Whereas.” These attempts show some structural variety, but control is uneven. “Whereas, householders…” is a dependent clause presented as a sentence, and “25 millions of householders have…” has an incorrect plural form and an awkward tense for reporting past data. Missing spaces after full stops and commas also affect punctuation, as in “2007.Allmost.” Aim for complete sentences and use the past tense consistently when describing the years shown: for example, “In 2007, there were about 25 million households earning less than $25,000.”
See this exact question answered at other band scores. The same prompt compared across bands.
Browse more IELTS Writing model answers or get your own writing scored by the same AI examiner.