Band 5.0 IELTS Writing Task 1 Model Answer
Overall Band Score: 5.0 · Cambridge IELTS 18 · 2026-11-06
IELTS Writing Task 1 question
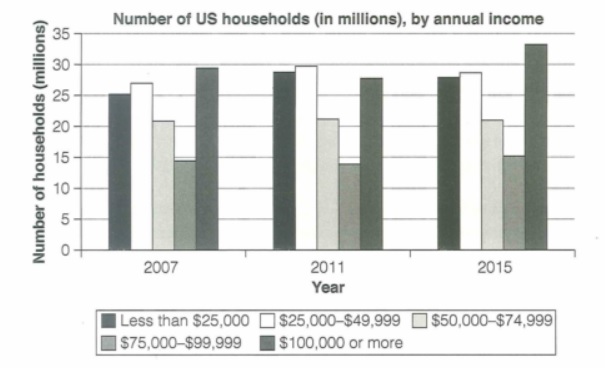
The chart below shows the number of households in the US by their annual income in 2007, 2011 and 2015.
Summarize the information by selecting and reporting the main features and make comparisons where relevant.
Student answer (Band 5.0)
The given shows the number of households in United States by their annual income in 2007, 2011 and 2015.
There were almost 25 million households with less than $25,000 income in 2007. There were almost 27 million houses had the income between $25,000 to $49,999. Almost 21 million houses had the income between $50,000 to $74,999. Almost 14.5 million houses had the income between $75,000 to $99,999. There were 29.5 million households who have $100,000 or more income which was the greatest number of households in 2007.
In the year 2011 there were almost 29 million houses those who has the income less than $25,000, 30 million had the income between $25,000 to $49,999, 21 million houses had income between $50,000 to $74,999, 14 million had the income between $75,000 to $99,999 and 27 million had $100,000 or more.
In 2015, almost 27 million households had the sallery less than $25,000, 28 million had sallery between $25,000 to $49,999, 21 million families had the annual sallery between $50,000 to $74,999, almost 15 million people had sallery between $75,000 to $99,999 and 38 million had the income of $100,000 or more.
AI examiner evaluation
| Criterion | Band |
|---|---|
| Task Achievement / Task Response | 4.5 |
| Coherence and Cohesion | 5.5 |
| Lexical Resource | 5.0 |
| Grammatical Range and Accuracy | 5.0 |
| Overall | 5.0 |
Task Achievement / Task Response: Band 4.5
You report figures for all three years and identify the highest category in 2007, so the response is relevant and includes several key data points. However, it mainly lists figures rather than summarising the main patterns, and there is no clear overview of the overall changes. One important figure is substantially inaccurate: the 2015 total for households earning $100,000 or more is about 33.5 million, not 38 million. The other categories are generally close to the chart. To strengthen the report, add an overview noting that the highest-income group rose markedly by 2015, while the $50,000–$74,999 group remained stable, and make accurate comparisons across years. (The length requirement is met.)
Coherence and Cohesion: Band 5.5
The response has a basic chronological structure: it presents the figures for 2007, then 2011, and finally 2015. This makes the information reasonably easy to follow, and the paragraph breaks help separate the years. However, the organisation is largely a repeated list, with little progression from individual figures to an overall comparison. Repeated openings such as “There were” and “In the year 2011” make the report mechanical, while links between categories and trends are limited. Grouping the data by pattern—for example, stable categories versus those that changed—and using concise comparisons would create a clearer progression. A separate overview paragraph would also help readers understand the main message before the detailed figures.
Lexical Resource: Band 5.0
You use relevant terms such as “households,” “income,” and “annual,” and the income brackets are generally described clearly. However, the vocabulary is repetitive, particularly the repeated use of “had the income” and “million houses.” Some choices are inaccurate or unsuitable for this chart: “sallery” is misspelled and refers to pay rather than household income, while “people” is not the unit being counted. The phrase “the given shows” is also an awkward way to introduce a chart. Use a more precise range of reporting language, such as “the number of households,” “the income bracket,” “stood at,” and “increased to,” while checking spelling and collocation.
Grammatical Range and Accuracy: Band 5.0
Most of the response uses simple sentence patterns, and the reader can generally understand the intended comparisons. However, grammatical control is uneven, with recurring problems in sentence construction and verb forms. For example, “There were almost 27 million houses had the income” incorrectly combines two clause structures; use “There were almost 27 million households in this bracket” or “Almost 27 million households had incomes in this bracket.” The forms “those who has” and “who have” also show inconsistent agreement and awkward relative clauses. Articles and prepositions are sometimes missing or incorrectly used, as in “in United States” and “between $25,000 to $49,999.” Practise accurate, varied comparison sentences and check agreement and clause structure.
See this exact question answered at other band scores. The same prompt compared across bands.
Browse more IELTS Writing model answers or get your own writing scored by the same AI examiner.