Band 5.5 IELTS Writing Task 1 Model Answer
Overall Band Score: 5.5 · Cambridge IELTS 18 · 2026-11-09
IELTS Writing Task 1 question
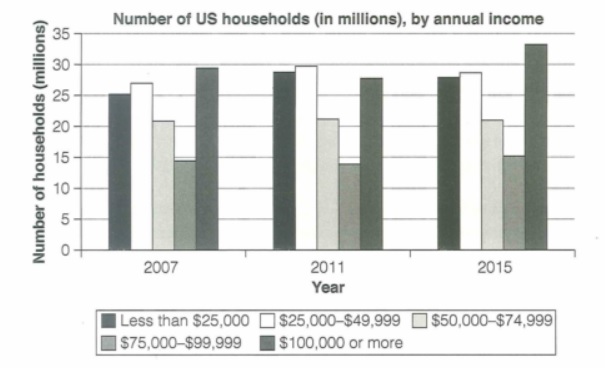
The chart below shows the number of households in the US by their annual income in 2007, 2011 and 2015.
Summarize the information by selecting and reporting the main features and make comparisons where relevant.
Student answer (Band 5.5)
The bar chart describes the number of household in the US according to their annual income in the year of 2007, 2011 and 2015. By analyzing the graph, we can get a crystal clear idea about the variation between the household numbers among the the years and how it evolved.
Those people who had income less than $25000, had 25 millions household in 2007. which increased to 28.5 millions in 2011. In 2015, the number again declined a little bit and became 27 million. So, The gap is not that much significant between 2011 to 2015. The people who had income in between $25000-$49999 had 26 millions households in 2007. In 2011 it became 30 millions. After that again in 2015 the number got decreased and became 28.5 millions. The 3rd catagory people had income in between $50000-$74999. In 2007 this catagory people had 21 millions households. The number remained consistant during 2011 and 2015. Then the people with income between $75000-$99999 had 14 millions household in 2007 which decresed a little in 2011 and obtained the 13 millions value. Then in 2015 it incresed a little and secured 15 millions. The last catagory have income between $[redacted phone] or more. The are the richest people in US. The graph showcase that in 2007 they had 29 millions household. This decresed a little during 2011 and became 27 millions. In 2015 it got incresed and the number is 33 millions. This is the highest figure in the bar chart.
AI examiner evaluation
| Criterion | Band |
|---|---|
| Task Achievement / Task Response | 5.0 |
| Coherence and Cohesion | 5.5 |
| Lexical Resource | 5.5 |
| Grammatical Range and Accuracy | 5.5 |
| Overall | 5.5 |
Task Achievement / Task Response: Band 5.0
You cover all five income groups and report several relevant changes, including the stable figure of 21 million for the middle-income group and the rise in the $100,000-or-more group to the chart’s highest level in 2015. However, the response is mainly a sequence of category-by-category details rather than a clear overview of the chart’s main patterns. Some figures are also inaccurate: the under-$25,000 group is about 28 million, not 27 million, in 2015; the $25,000–$49,999 group is about 27 million in 2007, not 26 million; and the $75,000–$99,999 group is about 14 million in 2011, not 13 million. Add a concise overview and check figures against the chart.
Coherence and Cohesion: Band 5.5
The response follows a generally understandable order, moving through the income categories, and time markers such as “In 2011” and “In 2015” help readers follow changes. However, nearly all the information is placed in one long paragraph, so the overview and supporting details are not clearly separated. The repeated pattern of “Then,” “After that,” and “In 2015” makes the progression mechanical, while the opening comments about getting a “crystal clear idea” do not introduce a specific main trend. Organise the response into an introduction, a brief overview, and one or two detail paragraphs. Use comparisons between groups, rather than relying mainly on repeated chronological transitions.
Lexical Resource: Band 5.5
You use relevant chart vocabulary, including “increased,” “declined,” “remained,” and “highest figure,” so the main movements are usually understandable. However, the range is limited and some choices are informal or imprecise for an academic report: “a little bit,” “got decreased,” “secured 15 millions,” and “crystal clear idea” are not natural descriptions of chart data. Spelling errors such as “catagory,” “consistant,” “decresed,” and “incresed” are also noticeable. Aim for precise, neutral language and accurate forms, for example “rose to,” “fell slightly,” and “remained stable.” Avoid describing income groups as “the richest people”; name the category instead.
Grammatical Range and Accuracy: Band 5.5
You attempt both simple and longer sentences, and the reader can generally understand the sequence of changes. However, errors recur in sentence boundaries, agreement, articles, and plurals. For example, “25 millions household” should use a plural noun and a more suitable number expression, while “The last catagory have income” has a subject–verb agreement problem. The fragment “which increased to 28.5 millions in 2011” begins with a lowercase letter after a full stop, and “The are the richest people” is missing a word. Some sentences also join several changes with repeated “Then” clauses, making control less secure. Practise accurate sentence boundaries and consistent past-tense reporting, while checking singular and plural forms.
See this exact question answered at other band scores. The same prompt compared across bands.
Browse more IELTS Writing model answers or get your own writing scored by the same AI examiner.