Band 5.5 IELTS Writing Task 1 Model Answer
Overall Band Score: 5.5 · Cambridge IELTS 18 · 2026-11-09
IELTS Writing Task 1 question
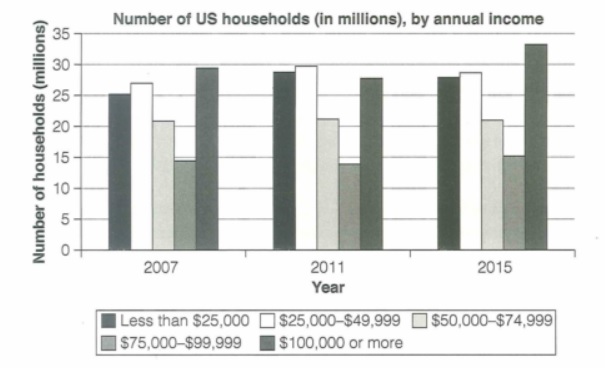
The chart below shows the number of households in the US by their annual income in 2007, 2011 and 2015.
Summarize the information by selecting and reporting the main features and make comparisons where relevant.
Student answer (Band 5.5)
The bar-chart illustrates the number of households in the United States by their yearly earnings in years 2007, 2011 and 2015.
Overall, the number of citizens who earned 100,000 dollars or more were constantly high through the 3 years, while people who earned 75,000-99,999 dollars were the least.
In 2007, just under 30 million households earned at least 100,000 dollars, then the number declined to 28 million in 2011, which dramatically increased again to 33 millions of households.
The difference between numbers of people who earns 25,000-49,999 dollars and less than that is constantly around 2 million. 2007 was the year when households which earn that amount of money was the lowest around 26 million. After that, in 2011, the numbers increased to 30 million, then dropped to household number of 28 million.
Households which earn 50,000-74,999 dollars were stable through 3 years at exactly 21 million, meanwhile households which earn 75,000-99,999 dollars were constant around 14 million.
To conclude, US citizens earn average of 25,000 dollars a year.
AI examiner evaluation
| Criterion | Band |
|---|---|
| Task Achievement / Task Response | 5.0 |
| Coherence and Cohesion | 6.0 |
| Lexical Resource | 5.5 |
| Grammatical Range and Accuracy | 5.5 |
| Overall | 5.5 |
Task Achievement / Task Response: Band 5.0
You identify the main categories and provide an overview, noting that the $75,000–$99,999 group was the smallest and that the $100,000-plus group remained high. However, the overview is not fully accurate: the highest-income group did not stay consistently high, as it fell from about 29.5 million to 27.5 million before rising to 33.5 million. Several figures are also misreported: the $25,000–$49,999 group was about 27, 29.5 and 28.5 million, not 26, 30 and 28; the under-$25,000 group was about 25, 28.5 and 28 million. The final claim about average earnings is unsupported by the chart. Select and compare the key trends more accurately, and avoid conclusions the data cannot establish.
Coherence and Cohesion: Band 6.0
The response has a clear overall arrangement: an introduction, an overview, and paragraphs describing the income groups. This makes the information reasonably easy to follow. Linking expressions such as “Overall,” “After that,” and “To conclude” help signal stages in the response, although the conclusion repeats an unsupported claim rather than summarising the chart’s main pattern. Some connections between comparisons are unclear, particularly “The difference between numbers of people who earns…” because the comparison is not expressed cleanly. The repeated use of “then” also makes parts of the account feel mechanical. To improve progression, group related income bands together and use clearer references to the household figures and years being compared.
Lexical Resource: Band 5.5
You use relevant chart vocabulary, including “declined,” “increased,” “stable,” and “households,” and the income ranges are generally identified clearly. However, some word choices are imprecise or unsuitable for describing this data. The chart counts households, not “citizens” or “people,” so those substitutions reduce precision. “Constantly high” is vague, while “dramatically increased” overstates the change and does not describe the movement precisely. There is also awkward phrasing in “household number of 28 million” and “earn average of 25,000 dollars.” Aim for accurate collocations such as “the number of households rose” and “remained broadly stable.” More precise language would make the comparisons clearer and more appropriately formal.
Grammatical Range and Accuracy: Band 5.5
You attempt a mix of simple and more complex sentences, including clauses linked with “while” and “which,” and the overall meaning is usually understandable. Some errors in agreement, tense and sentence construction remain. For example, “the number of households … were” should use a singular verb, and “people who earns” has incorrect subject–verb agreement. In “then the number declined …, which dramatically increased again,” the relative clause has an unclear reference; make the households the subject of the second movement. The sentence beginning “The difference between numbers…” also shifts awkwardly between present and past forms. Check agreement and keep past-tense reporting consistent, while making sure each clause clearly identifies what changed.
See this exact question answered at other band scores. The same prompt compared across bands.
Browse more IELTS Writing model answers or get your own writing scored by the same AI examiner.