Band 5.0 IELTS Writing Task 1 Model Answer
Overall Band Score: 5.0 · Cambridge IELTS 18 · 2026-11-09
IELTS Writing Task 1 question
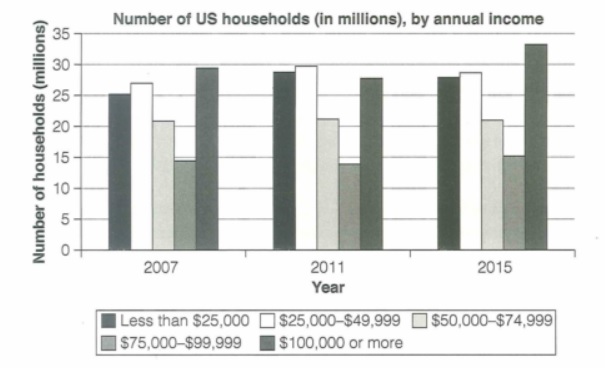
The chart below shows the number of households in the US by their annual income in 2007, 2011 and 2015.
Summarize the information by selecting and reporting the main features and make comparisons where relevant.
Student answer (Band 5.0)
The bar chart illustrates the amount of households in the US by their annual income in 2007, 2011 and 2015.
Overall, in three particular years succesfully earn almost same amount of households on the US by their annual income. The highest households annual income gain in 2015, while in 2007 gain the lowest households annual income as compare to others years.
In 2015, number of households earn maximum number of annual incomes. Almost 32 million households earn less than $25,000 in 2015. In 2015, exactly $25,000 to $49,000 earn by about 29 million households. Nearly 28 million households eran $100,000 or more in the US by their annual income in 2015.
In 2011 and 2007, overall income was quite low as compare to others years households income. Almost 29 million households earn less than $25,000 in 2007. In 2007, exactly $25,000 to $49,000 earn by approximately 27 million households. Nearly 29 million households earn less than $25,000 in 2011. About $25,000 to $49,000 earn by approximately 29 million households in 2011.
AI examiner evaluation
| Criterion | Band |
|---|---|
| Task Achievement / Task Response | 4.0 |
| Coherence and Cohesion | 5.0 |
| Lexical Resource | 5.0 |
| Grammatical Range and Accuracy | 5.0 |
| Overall | 5.0 |
Task Achievement / Task Response: Band 4.0
The response identifies the chart’s subject and gives some figures for the income groups, but it does not provide a reliable overview of the main patterns. The claim that 2015 had the maximum number of households is too broad: the $50,000–$74,999 group stayed at about 21 million, while the $100,000-or-more group rose to the chart’s highest value, around 33.5 million. Several figures are misreported, including less than $25,000 in 2015 (about 28 million, not 32 million) and $100,000 or more in 2015 (about 33.5 million, not 28 million). The response also omits the $75,000–$99,999 group and gives little comparison across all three years. It is one word below the 150-word minimum; the 22 words copied from the prompt were not counted.
Coherence and Cohesion: Band 5.0
The response has a basic paragraph structure: an introduction, an overview, and two paragraphs covering selected years. This gives the reader some organisation, and time markers such as “In 2015” and “In 2011 and 2007” help locate the information. However, there is no clear progression through the chart’s five income bands, and the final paragraph repeats the same lower-income categories rather than developing a comparison. The overview is difficult to follow, and links such as “while” and “as compare to” do not clearly express the intended relationships. To improve, group the figures by meaningful trends—for example, compare the highest-income category across years, then describe the stable or similar lower bands—and use clear, accurate linking phrases.
Lexical Resource: Band 5.0
The response uses a small set of relevant chart terms, including “households,” “annual income,” “approximately,” and “million,” so the topic is generally recognisable. However, vocabulary is repetitive and several word choices or collocations make the meaning unclear. “Amount of households” is not natural for countable units; use “number of households.” Phrases such as “earn maximum number of annual incomes” and “gain the lowest households annual income” do not accurately describe the data. There are also spelling errors, including “succesfully” and “eran,” and the income ranges are sometimes expressed awkwardly. Build a more precise range for describing figures and trends, such as “stood at,” “increased to,” “remained stable,” and “the largest category.”
Grammatical Range and Accuracy: Band 5.0
The response communicates some basic information through simple sentences, but its grammatical range is limited and errors occur frequently. Verb forms are often incorrect: “households earn” should generally be “households earned” when describing past data, while “earn by about 29 million households” needs a passive construction such as “was reported for about 29 million households.” The overview sentence “in three particular years succesfully earn almost same amount of households” lacks a clear grammatical structure, and “the highest households annual income gain” has unclear word order and agreement. Articles and comparison patterns are also problematic, as in “on the US” and “as compare to others years.” Practise accurate past-tense reporting and straightforward comparative sentence patterns before attempting more complex structures.
See this exact question answered at other band scores. The same prompt compared across bands.
Browse more IELTS Writing model answers or get your own writing scored by the same AI examiner.