Band 5.0 IELTS Writing Task 1 Model Answer
Overall Band Score: 5.0 · Cambridge IELTS 18 · 2026-11-10
IELTS Writing Task 1 question
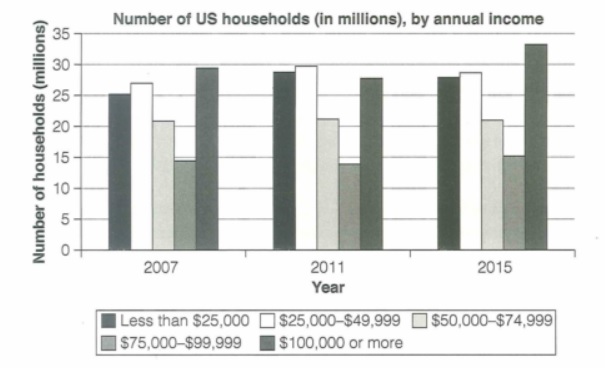
The chart below shows the number of households in the US by their annual income in 2007, 2011 and 2015.
Summarize the information by selecting and reporting the main features and make comparisons where relevant.
Student answer (Band 5.0)
the chart illustrates, the number of housholds in the US by their anunual income in 2007,2011 and 2015.
It can be seen that in 2015 year the annual income high compare to all years an the less income year is 2011 year compare to all the year.
AT the beginning of the year in 2007 the number of household number were 25 million of peoples with the amount of less than 25 thousand dollar annual incomee but same in the year of 2007 the number of 14 million people houshold income is 1 hundred thosuand dollar also so in the comparison the people high people anual income were less .
reagrding to highest income people number were less in number which was 1 hundred thousand dollar or more.the number of households earning between $50,000 and $74,999 remained relatively stable at approximately 21 million throughout the period. Similarly, the $75,000–$99,999 cate
AI examiner evaluation
| Criterion | Band |
|---|---|
| Task Achievement / Task Response | 5.0 |
| Coherence and Cohesion | 4.0 |
| Lexical Resource | 5.0 |
| Grammatical Range and Accuracy | 5.0 |
| Overall | 5.0 |
Task Achievement / Task Response: Band 5.0
The response includes some relevant figures and trends, particularly the accurate statement that the $50,000–$74,999 group stayed at about 21 million and that the $75,000–$99,999 group was broadly stable. However, the overview is unclear and partly inaccurate: saying 2015 had the “annual income high” and 2011 the “less income” does not identify which household categories rose or fell. The account of 2007 also confuses income groups and household numbers, and the claim that the highest-income group was “less in number” conflicts with the chart: it was the largest group in 2007 and reached about 33.5 million in 2015. Select the main comparisons accurately and give a clear overview before describing details.
Coherence and Cohesion: Band 4.0
There is an attempt to move from an introduction to an overview and then to details, and phrases such as “It can be seen” and “Similarly” signal relationships. However, the progression is difficult to follow because the overview is vague, the 2007 comparison is tangled, and the final sentence ends abruptly at “cate”. Connections between ideas are often unclear, as in “but same in the year of 2007,” while repeated references to “the year” do not help the reader track comparisons. Use separate, complete paragraphs for the overview and key data, and organise the details by meaningful groups or trends rather than moving between figures without clear links.
Lexical Resource: Band 5.0
The response uses some task-relevant vocabulary, including “households,” “annual income,” “remained relatively stable,” and “approximately,” which helps communicate the chart’s subject. However, the range is limited and several word choices or forms make the meaning difficult to interpret: “annual income high,” “less income year,” and “people high people anual income” are not natural descriptions of the data. Spelling errors such as “housholds,” “anunual,” and “thosuand” are also noticeable. Build a more precise set of comparison terms, such as “increased,” “declined,” “was the largest category,” and “accounted for,” and check spelling and collocations before submitting.
Grammatical Range and Accuracy: Band 5.0
There are attempts at both simple and more complex sentences, including the clause beginning “the number of households earning between…” and the comparison introduced by “but.” However, many sentence structures are faulty, and errors frequently make relationships between figures hard to understand. For example, “the number of household number were 25 million” has problems with repetition, agreement, and sentence construction; “in 2015 year” and “the less income year is 2011 year” also show weak article and noun-phrase patterns. Punctuation and capitalisation are inconsistent, including “AT” and long sentences joined without clear boundaries. Practise writing short, complete comparisons with accurate subject–verb agreement, articles, and past-tense verbs.
See this exact question answered at other band scores. The same prompt compared across bands.
Browse more IELTS Writing model answers or get your own writing scored by the same AI examiner.